Statistic Information
You can get detailed information about all statistics in a panel by selecting Show Statistic Data in the Panel pop-up menu. This summons the Statistic Information dialog box, within which you can view statistic information, modify statistic data, or build a new statistic with your own data.
Figure 148: Statistic Information Dialog Box
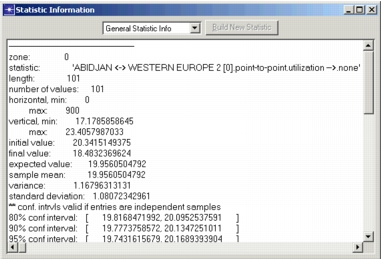
The following table lists the available operations.
Table 70: Statistic Information Dialog Box Operations
| Name | Description |
|---|---|
| General Statistic Information | Displays information about each statistic in the panel, such as number of entries, minimum and maximum values, statistical data, and operations performed on the statistic. |
| Statistic Data | Displays detailed information about each statistic in the panel, including the horizontal and vertical values of each entry. This is the alternative selection to General Statistic Info on the pull-down menu in the dialog box. This is the default display when the dialog box appears. |
| Build Statistic | Converts the statistic description in the dialog box into vectors that can be graphed in an analysis panel. |
| Exit Statistic Information | Closes the Statistic Information dialog box. |
General Statistic Information
The General Statistic Info operation provides high-level information about all statistics in a panel. Information about each statistic of a multiple-statistic panel is listed in the order in which the statistics appear in the panel. The information given applies only to the portion of a statistic that falls within the horizontal range of the panel (though entries immediately preceding and immediately following the range may be included as well).
The following table lists the information provided by this operation.
Table 71: General Statistic Information Labels
| Label | Description |
|---|---|
| zone | Name of the graph in which the statistic is drawn. |
| statistic | Name of the statistic to which the following information applies. |
| parameter | Name and current value of a parameter, if any. |
| length | Number of entries in the statistic (including the end-of-statistic entry). |
| number of values | Number of entries with values in the statistic (excluding entries with undefined values and the end-of-statistic entry). |
| horizontal min, max | Minimum and maximum horizontal values in the statistic. |
| vertical min, max | Minimum and maximum vertical values in the statistic. |
| initial value | Vertical value of the first entry. |
| final value | Vertical value of the last entry. |
| expected value | Average vertical value as calculated by the Time-Average Filter. |
| sample mean | Mean vertical value as calculated by the Average Filter. |
| variance | Variance of vertical values (the mean value of the squared deviation from the sample mean). |
| standard deviation | Typical distance between an vertical value and the mean vertical value (computed as the square root of the variance). |
| confidence intervals | Intervals estimated to contain the true mean of the vertical values at five different levels of confidence. These results are meaningful only if the entries are independent samples. |
| operations list | List of all operations performed on the statistic since the panel's creation. |
Statistic Data
The Statistic Data operation displays information about all statistics in the panel. Information about each statistic of a multiple-statistic panel is listed in the order in which the statistics appear in the panel. The information given applies only to the portion of a statistic that falls within the horizontal range of the panel (though entries immediately preceding and immediately following the range may be included as well).
Figure 149: Statistic Data
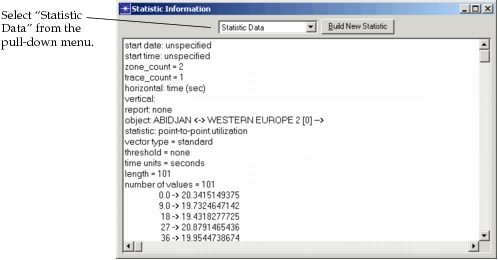
The following table lists the information provided by this operation.
Table 72: Statistic Data Labels
| Label | Description |
|---|---|
| start date | Start date of the simulation. |
| start time | Start time of the simulation |
| zone_count | Number of graphs in the panel. |
| trace_count | Number of statistics in the panel. |
| horizontal | Horizontal label of the panel. |
| vertical | Vertical label of the statistic. |
| report | Name of SLA report associated with statistic |
| object | Object associated with statistic. |
| statistic | Statistic name. |
| vector type | Enumerated, Summary or Standard. |
| threshold | Threshold value of any associated SLA report. |
| time units | Time units of simulation. |
| length | Number of entries in the statistic (including the end-of-statistic entry). |
| number of values | Number of entries with values in the statistic (excluding entries with undefined values and the end-of-statistic entry). |
<unlabeled> |
Horizontal and vertical values of each entry. |
Build Statistic
The Build Statistic operation generates new statistics from ASCII data in the Statistic Data edit pad. This data can come from either of two sources:
- Existing statistic data displayed in the edit pad and modified there.
- New data created externally and loaded into the edit pad using the Read File operation.
In either case, Build Statistic converts the ASCII data into vectors that can be plotted. The data must be in the same format used by the Statistic Data operation to display statistic information, as shown in the following figure.
Figure 150: Analysis Panel and Equivalent Textual Representation
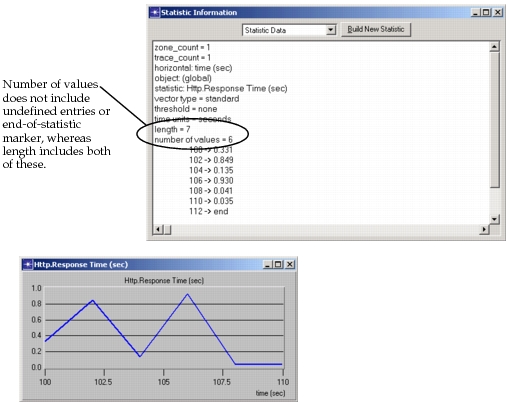
The Build Statistic operation can generate panels with several statistics. This requires that the ASCII input contain multiple sets of data, one for each statistic. The data for each statistic must be separated from that of the next statistic by an end-of-statistic entry (end). The data for the last statistic must also end this way.
Procedure 167: Building a Statistic
-
Right-click in an existing panel, then select Show Statistics Data from the pop-up menu.
The Statistic Information dialog box appears.
-
Choose Statistic Data from the pull-down menu (the default selection is General Statistic Info).
The Statistic Data display appears in the dialog box.
-
Create new statistic data in one or both of the following ways:
- Modify the existing statistic data by entering new values or changing existing values in the edit pad.
- Load a file containing predefined statistic data using the copy and paste text edit area operations (as described in "Text Edit Pads" on page 10). Be sure any ASCII text files created outside of Riverbed Modeler match the format used by the Statistic Data display.
-
When the new statistic data is complete, click the Build Statistic button.
The new statistic is built. The guidance display prompts you to select a location for the new panel.
-
Select an area for the new panel in the tool window.
The panel is created showing the new statistic.