Graphs
A graph usually describes one statistic (such as utilization, response time, or throughput) and how that statistic changes during a simulation. Most graphs represent data using an x,y plot in which the horizontal (x) axis represents the simulation time and the vertical (y) axis represents the measured value.
Figure 114: Results Browser—Graphs Page
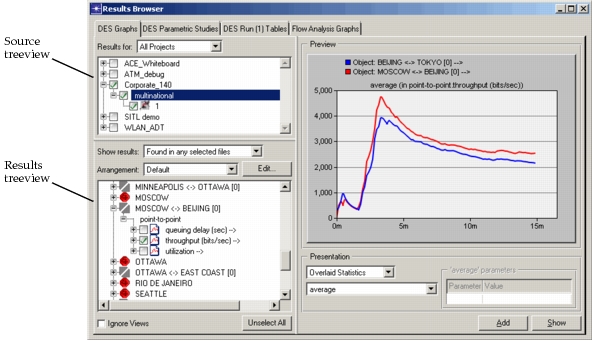
Graphs are displayed in analysis panels, which you create from a Graphs page in the Results Browser. To create an analysis panel graph, do the following procedure.
Procedure 142: Creating an Analysis Panel Graph
-
Open the Results Browser.
-
Click the Graphs tab corresponding to the type of results that you want to view (for example, DES Graphs).
The dialog box switches to the requested Graphs page.
-
Select the source of the results you want to view:
3.1 From the “Results for:” pull-down menu, choose whether to look at the current scenario, the current project, or all results in the computer’s model directories.
3.2 Select the desired source files in the source (top) treeview.
-
Select the specific results you want to view:
4.1 From the “Show results:” pull-down menu, choose which results to consider:
- Common to all selected files – only results that appear in every source file
- Found in any selected files – every result found in at least one of the source files
4.2 Use the Ignore Views checkbox to specify which results are included in the results treeview.
When this checkbox is selected, all results are included in the treeview. When unselected, only results for objects that are visible in the current view are included.
4.3 If desired, use the “Arrangement:” pull-down menu to change the hierarchy of the results treeview:
- Choose a saved arrangement. If none of the available arrangements meets your needs, follow the Defining an Arrangement for the Results Browser procedure to define a new arrangement.
4.4 Select one or more results in the results (bottom) treeview.
The selected results are drawn in the Preview pane.
-
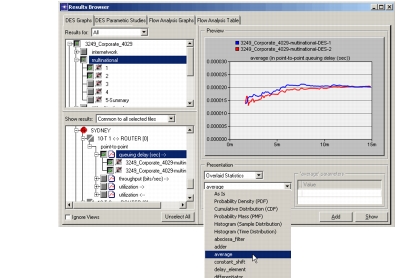
Use the Presentation controls to specify how the results should be displayed:
5.1 If you have selected two or more results, use the first pull-down menu to specify whether they should be drawn in the same graph (Overlaid Statistics) or in separate graphs (Stacked Statistics).
5.2 If desired, use the second pull-down menu to choose a computation or filter to be applied to the results. For descriptions of the filters, see “Predefined Filters” on page 457.
If the filter operates on more than one result, such as the adder filter, the filter is applied to the results in the order they were chosen.
If the filter requires additional parameters, enter them in the corresponding fields.
-
Click the Show button.
An analysis panel opens showing the results you selected. The Results Browser remains open. You can right-click on the analysis panel or graph to edit their appearance.
Defining an Arrangement for the Results Browser
You can change the order in which results are listed on Graph and Parametric Studies pages in the Results Browser and what information is displayed about the results. The Statistics Tree Arrangement editor lists all properties (such as statistic names and tags) that can be used to define the results tree hierarchy. In this editor, you can specify which properties are used to build the tree and in what order they are used.
Note: Statistic tags can be added by editing the statistic’s “tag” attribute or by the model developer via KPs in the “Statistic Package”. You can specify that tags be added automatically based on statistic values by specifying Statistic Value Ranges.
Use the following procedure to define a custom hierarchy for the results treeview in the Results Browser.
Procedure 143: Defining an Arrangement in the Results Browser
-
In the Results Browser, click the Edit… button.
The Statistics Tree Arrangement editor opens.
-
Use the “Hierarchy in statistic tree” pane to specify which properties should be used to form the tree hierarchy and the order in which they should be used.
- To remove an unwanted property, select it and click the Remove button. The property is removed from the hierarchy list and added to the “Statistic information display” list.
- To add a property, click on “Click to add…” and select the property from the pop-up list. The property is removed from the “Statistic information display” list and added to the hierarchy list.
- To change the order of a property, select it and repeatedly click the Move Up or Move Down button until the property is in the desired position.
-
Use the “Statistic information display” pane to specify which properties should be included in a properties node immediately above the lowest level (file) node.
- To include a property, click in its Display? cell to toggle the value to Yes.
- To change the order of a property, select it and repeatedly click the Move Up or Move Down button until the property is in the desired position.
The properties listed in the “Statistic information display” pane represent all tags associated with the statistics currently listed in the Results Browser, plus any default properties that have been removed from the “Hierarchy in statistic tree” pane.
-
If you want to save this hierarchy for future use, click the Save As… button. Specify a model directory and file name, then click Save.
Arrangements are saved as model files and are available to any project.
-
Click OK.
The Statistics Tree Arrangement editor closes and the new hierarchy is applied to the results treeview in the Results Browser.