Statistic Value Ranges
Statistic definitions include four attributes designed to help you identify abnormal values. These attributes are “critical low value”, “warning low value”, “warning high value”, and “critical high value”. The values of these attributes can be viewed when the statistic is plotted in analysis panel graphs and used to organize statistics in the Results Browser. One use of statistic value ranges is to track violations of service level agreements, providing an alternate view to the method described in Expert Service Prediction (Define SLAs).
You can set the value range attributes when defining a statistic in a model editor (node, link, path, demand, or process) or by editing the statistic attributes in a probe model via the Choose Statistics (Advanced) operation.
The attributes “critical low value”, “warning low value”, “warning high value”, and “critical high value” appear on the following objects:
- node statistic probe object
- link statistic probe object
- path statistic probe object
- demand statistic probe object
- global statistic probe object
- live statistic probe object
Viewing Statistic Value Ranges in Graphs
If you assign a value to one or more of these attributes, analysis panel graphs of the statistic will have background colors indicating the ranges for critically low, low, normal, high, and critically high values. (The background colors can be changed using the preferences described in Preferences for Value Range Display.)
Figure 116: Graph with Value Ranges
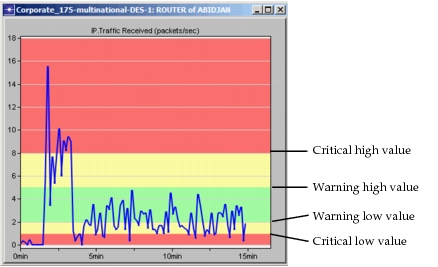
If a value range attribute is set and the Show Range Background Colors preference is TRUE, the colors are shown automatically when you graph the statistic. However, value ranges are not shown if the presentation makes them meaningless. For example, ranges are not shown in these cases:
- the statistic is overlaid with others
- the meaning of the graph is altered by a filter (for example, changed to a probability plot or histogram)
Viewing Statistic Value Ranges with Tags
When a statistic exceeds one of these attribute values (high or low), a tag is added to the statistic to indicate this condition. For example, a statistic with values that exceed the warning high and critical high values will have tags similar to these:
- Predominant Range Violation: Warning High < 20% of samples
- Range Violation Severity: Critical and possibly Warning
- Total Range Violations: < 30% of samples
Statistic tags let you group statistics that are exceeding their ranges when you view them in the Results Browser. One use for this feature is to set the “critical high value” attribute in accordance with a service level agreement, such as a maximum allowed end-to-end delay. You can then easily find and graph all statistics that are violating this SLA.
For details on how to use tags in the Results Browser, see Defining an Arrangement for the Results Browser.
Preferences for Value Range Display
These preferences control display of statistic value ranges in analysis panels. They can be found in the UI.Analysis Panels group.
Show Range Background Colors
Specifies whether analysis panels should display range colors in the background. When TRUE, background range colors will be shown when one or more of the following statistic attributes are set: “critical low value”, “warning low value”, “warning high value”, and “critical high value”.
| Tag | Type | Default Value |
|---|---|---|
panels_range_colors_show |
boolean | TRUE |
Range Critical High Color
Specifies the background color to be used in analysis panels for the area above the critical high value.
| Tag | Type | Default Value |
|---|---|---|
panels_range_critical_high_color |
color | #FF4444  |
Range Critical Low Color
Specifies the background color to be used in analysis panels for the area below the critical low value.
| Tag | Type | Default Value |
|---|---|---|
panels_range_critical_low_color |
color | #FF4444  |
Range Normal Color
Specifies the background color to be used in analysis panels for the area between the warning high value and warning low value.
| Tag | Type | Default Value |
|---|---|---|
panels_range_normal_color |
color | #88FF88  |
Range Warning High Color
Specifies the background color to be used in analysis panels for the area between the critical high value and warning high value.
| Tag | Type | Default Value |
|---|---|---|
panels_range_warning_high_color |
color | #FFFF88  |
Range Warning Low Color
Specifies the background color to be used in analysis panels for the area between the warning low value and critical low value.
| Tag | Type | Default Value |
|---|---|---|
panels_range_warning_low_color |
color | #FFFF88  |