Statistics Web Report
Statistics web reports are an HTML version of the data collected for a defined Statistics report.
The general workflow for a Statistics web report is:
- If needed, define a Statistics report. (Defining a Statistics Report)
- Choose the reports for which to collect data. (Choosing Statistics Reports)
- Generate the report. (Generating a Statistics Web Report)
- View the report. (Viewing Statistics Web Reports)
Generating a Statistics Web Report
When you generate a web report, Modeler takes the raw data collected by the simulation and creates HTML formatted pages that can be read by a web browser. Use the following procedure to generate a Statistics web report.
Procedure 150: Generating a Statistics Web Report Manually
-
Choose DES > Reports > Statistics Web Report > Generate Statistics Web Report…
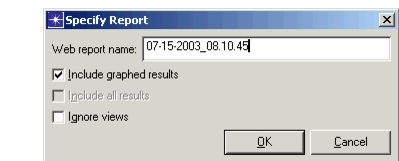
The Specify Report dialog box appears.
-
Optionally, rename the web report. The default web report name is the current date and time.
-
Specify which data to include in the web report:
- Include graphed results – creates web versions of graphs created in the Project Editor
- Include all results – includes all data specified through the Choose Reports operation
- Ignore views – includes data for all objects in the network, regardless of whether they appear in the current network view
-
Click OK.
The web report is created. The data contained in the report is that from the most recent simulation or (if you used the Configure Traffic Growth feature to run a set of simulations) from the most recent set. See Traffic Growth page – Used to define a set of simulations with increasing traffic levels in each simulation. for details on this feature.
You can also configure a simulation to generate a Statistics web report automatically when the simulation completes.
Procedure 151: Generating a Statistics Web Report Automatically
-
Open the detailed Configure/Run DES dialog box.
-
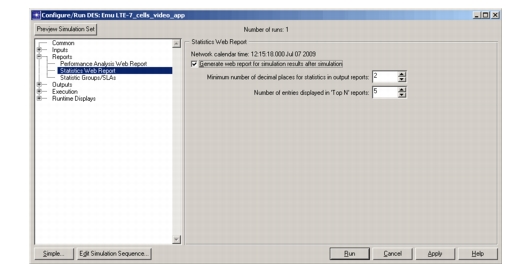
Select Reports: Statistic Web Report in the treeview.
-
Select the “Generate web report for simulation results after simulation” checkbox.
-
If desired, specify the number of decimal places and entries for the report.
-
Continue with other configuration options for the simulation, or click Run to start the simulation immediately.
When the simulation ends, a Statistic web report is generated. The data contained in the report comes from the simulation (or simulation set) that just ran.
Viewing Statistics Web Reports
The DES > Reports > Statistics Web Report > Launch Last Report operation lets you open a Statistics web report. There are two types of results that might appear in the report, depending on what was selected on the Statistic Groups/SLAs page of the Configure/Run DES dialog box (see Configure/Run DES Dialog Box (Detailed)—Report Controls):
- Reports
- SLAs (Service Level Agreements)
Both types of results contain Top Nodes and Links (also called Top Objects) and global statistics. SLA results also contain SLA violations and SLA close calls.
Procedure 152: Viewing the Most Recent Statistics Web Report
-
Choose DES > Reports > Statistics Web Report > Launch Last Report.
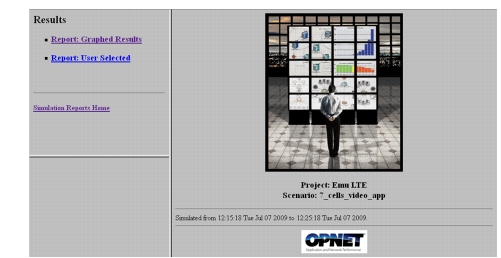
Your web browser opens to the home page for the most recently generated report.
-
Select one of the reports listed under Results or, if you want to view a different report, click the Simulation Reports Home link.
Procedure 153: Viewing Report Results
-
Follow the instructions in Procedure 152 to view the report home page.
-
Click on the desired object list or statistic group report.
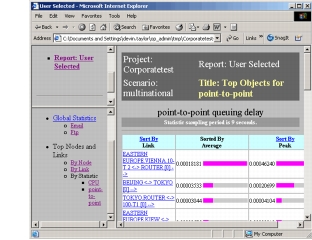
Figure 126: Object List Report
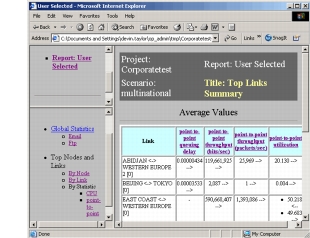
Figure 127: Statistic Group Report
-
Sort the statistic group report by percentage of service level agreement violations, average value, peak value, or node name, by clicking on the appropriate column heading.
-
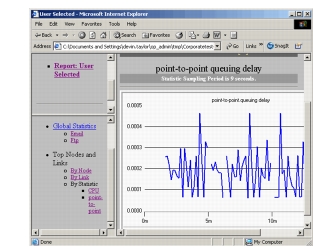
Click on a node name to view an individual node statistic graph. This graph is identical to an analysis panel graph of the same statistic, although it cannot be edited.
Procedure 154: Viewing SLA Results
-
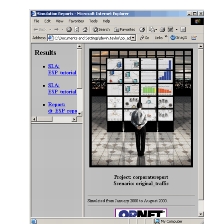
Follow the instructions in Procedure 152 to view the report home page.
-
Click on the SLA results that you want to examine.
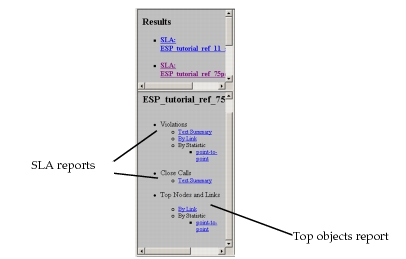
Links to the SLA’s violations and close calls reports, plus the top objects report, appear in the lower part of the link display area. If the SLA was not violated, you see links only to the text summary reports. If the SLA was violated, you see, in addition to the text summary reports, links to reports by object and statistic. Regardless of whether the SLA was violated, you will see a link to the Top Nodes and Links report.
-
Click on the link that displays the report.
See Table 62 for a list of available reports and graphs.
Table 62: SLA Reports
| Name | Access | Description |
|---|---|---|
| Violations Text Summary ¹ | Click on Violations:Text Summary link in link display area | If no violations, a simple statement. If violations, a list of objects that violated the SLA, with detailed descriptions of the violation. The list can be sorted by statistic. |
| Statistic graph and percentage compliance graphs | In Violations Text Summary report or Statistic_Group Violations report, click on object name | Same graphs as shown when you select View Results. For more information, see Viewing SLA Violations. |
Violations Summary By <Object> ¹ |
Click on Violations:By <Object> |
A table listing each link or node that violated a statistic and the statistic violated. Similar to the Top Nodes and Links report, except that all objects violating an SLA are listed and the statistic violated is color-coded. |
<Statistic_Group> Violations ¹ |
Click on By Statistic:<Statistic_Group>In Violations Summary By <Object> report, click on statistic name |
A table listing objects that violated the SLA relating to the statistic group, with detailed information about each object. The table can be sorted by object, average, or peak. |
<Statistic_Group> SLA Violations Timeline |
In <Statistic_Group> Violations report, click on click on Show violations timeline link |
A color-coded representation showing whether the SLA was violated during a time period. |
<Statistic_Group> SLA Violations Table |
In <Statistic_Group> Violations report, click on Show statistic table link |
Similar to the <Statistic_Group> Violations report, but a status column shows violations and close calls, and a periods columns shows the number of periods in violation. |
Top <Objects> Summary |
Click on Top Nodes and Links:By <Object> |
Same as Top Objects report, but SLA violations and close calls are color-coded. Similar to Violations Summary By <object> but limited to worst violators. |
Top Objects for <Statistic_Group> |
Click on Top Nodes and Links:By Statistic: <Statistic_Group> |
Similar to <Statistic_Group> Violations but lists top objects for each statistic. |
Top <Statistic_Group> SLA Violations Timeline |
In Top Objects for <Statistic_Group> report, click on Show violations timeline link |
A color-coded representation showing whether the SLA was violated during a time period. Similar to the <Statistic_Group> SLA Violations Timeline, but lists top objects for each statistic. |
Top Objects for <Statistic_Group> |
In Top Objects for <Statistic_Group> report, click on Show statistic table link |
Looks similar to the <Statistic_Group> SLA Violations Table, but lists top objects for each statistic, which may or may not have violated the SLA. |
Note 1: If applicable, an analogous Close Calls report may display