Tables
When viewing tables, you can do the following:
- View detailed documentation on a report – To view detailed information about the current report, choose Help > Describe Current Report.
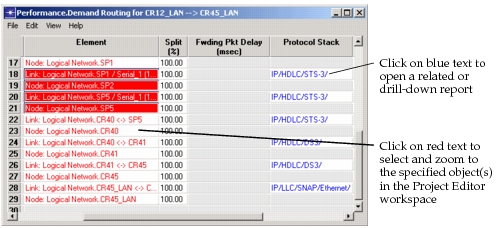
- Access more detailed reports – Blue text indicates that the simulation generated a related drill-down report. Click in the cell to open the detailed report.
- Select and zoom to objects in the Project Editor – Red text indicates a network object such a link, node, or demand. To select and zoom to one or more objects in the Project Editor, select the corresponding table cells.
- Export report to a spreadsheet, ASCII, or HTML file – To do this, choose File > Export.
- Search the table for a specified string – Use the Find operation (Edit > Find) to search the report.
- Copy one or more cells to clipboard – You can copy all or part of a report to the clipboard using the pop-up menu. You can then paste the report contents into a text editor or a spreadsheet program like Excel.
- Hide/Exclude/Restore rows or columns – Use the pop-up menu to perform these operations.
- Sort rows – To sort rows alphabetically or numerically, right-click in the column you want to use as the sort key.
Note: If any object in a table contains information that spans several rows, sorting the table might cause that table to present data inaccurately.
Figure 117: Table Viewer
Searching a Report
To search a report for specific information, choose Edit > Find in the table viewer. This opens the Find in Report dialog box, as shown in the following figure:
Figure 118: Find in Report Dialog Box
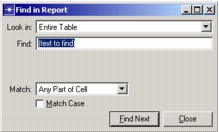
Table 60: Find in Report Dialog Box
| Option | Description |
|---|---|
| Look In | Specify the range of cells to search. You can search the entire table, a selected set of cells within the table, or a specified column. |
| Find | Specify the search string in this field. |
| Match | Specify the matching criteria. The options are: • Any Part of Cell – Find the next cell that has contents that match the search string • Whole Cell – Find the next cell whose entire contents match the search string • Start of Cell – Find the next cell with contents that start with the search string • Regular Expression – Find the next cell with contents that match a regular expression |
| Find Next | Find the next matching cell within the search set (as specified by the Look In setting) based on the Find and Match settings |
Generating Web Reports from the Results Browser
You can generate a web report that contains one or more of the reports available in the Results Browser.
Procedure 145: Generating a Web Report from the Results Browser
-
In the Project Editor, click the View Results toolbar button to open the Results Browser.
-
Click on the Table tab that has the results you want to view as a web report.
-
Click the Generate Web Report… button.
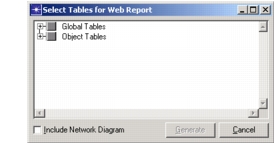
The Select Tables for Web Report dialog box appears.
Figure 119: Select Tables for Web Report Dialog Box
-
Choose the results you want to include in the web report.
-
Select the Include Network Diagram checkbox if you want the web report to include a graphic of the network topology.
-
Click Generate.
-
Select a directory for the HTML files and click OK. The default directory is
op_admin/web_reports/<project_name>-<scenario_name>@mm-dd-yyyy_hh.mm.ss.The Web report is created and opens in the default Web browser.
The web report contains links to all the reports you selected for inclusion. If the results you generated had an executive summary, this also appears as a link. The executive summary gives you a high-level overview report.
Through the web report, you can access the top-level and drill-down reports by navigating to them as you would in the table viewer. When you click on the name of a report in the frame on the left, the report appears in the frame on the right.
Visualizing Data in Web Reports
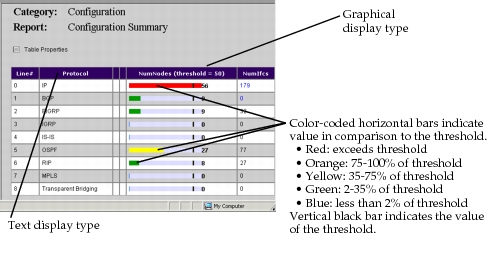
The Table Properties link in the web report lets you hide columns and configure data visualization parameters. To visualize the data in a report, you can configure some columns in the web report parameters to display data using a bar graph and the numerical value. When you do this, you also set a threshold, which is used to color-code the values.
Figure 120: Text and Graphical Display in a Web Report
Procedure 146: Configuring Table Properties for a Web Report
-
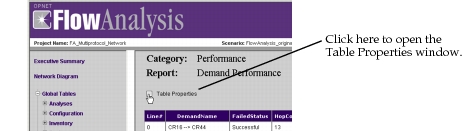
Click on the Table Properties link in a Web report.
Figure 121: Table Properties Link in a Web Report
-
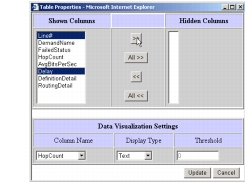
By default, all available columns are shown. Double-click on any entry to move it from the Shown Columns to Hidden Columns and vice versa. To move multiple columns at the same time, use Ctrl-click to select the columns, then click the “>>” button to move them to the Hidden Columns box.
Figure 122: Table Properties Window
-
Configure the Data Visualization Settings. The parameters are listed in the following table.
Table 61: Data Visualization Parameters
Parameter Description Column Name Lists the columns with a configurable display type. Display Type Determines if the data is represented graphically. The default setting is text, which means that no visualization is included. Threshold Sets the threshold value for use with graphical display type. This parameter is unavailable when the Display Type is Text. -
Click Update.