Generate Distribution From Trace
You can generate a PDF file from a statistic trace by selecting Generate Distribution From Trace in the Panel pop-up menu. You can then view or edit the generated file using the PDF editor. See "PDF Editor" on page 539 for more information about PDFs.
Variations of the following algorithm are used to generate a PDF from a statistic:
- Take the CDF of the statistic;
- Resample the CDF function at regular intervals;
- Take the forward derivative at each data point to calculate the PDF;
- Apply a moving average function to the PDF to get a smoother-looking function.
The PDF filter has two parameters: the sample count used in step 2 and the window (in points) of the moving–average function used in step 4.
The specific algorithm used to generate the PDF depends on which filter (if any) was applied to the statistic trace:
- Raw Values - If the trace uses unfiltered statistic data, perform the PDF-generation algorithm described previously.
- CDF - perform steps 2, 3, and 4 of this algorithm.
- PDF - resample the PDF and perform step 4 of this algorithm.
- histogram- normalize each trace value and generate a PDF from these values. The sample count is reset to 500 points. This results in a PDF function that corresponds to the original histogram, but has a total area of 1.
- PMF - treat each trace point as an impulse with the same ordinate and abscissa values. The resulting PDF is a series of impulses that corresponds to the original statistic trace.
Procedure 169: Generating a PDF from a Statistic Trace
-
Select Generate Distribution From Trace from the Panel pop-up menu.
The General Probability Distribution Function dialog box appears.
Figure 154: Generate Probability Distribution Function Dialog Box
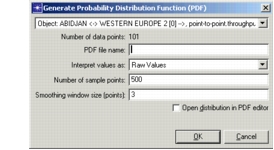
The Interpret Values As pull-down menu determines which algorithm to use when generating the PDF. The default setting for this menu is set to the filter most recently applied to the statistic trace. If the trace uses unfiltered statistic data, “Raw values” is the default.
Note: This setting is incorrect only in rare circumstances; for example, using a customized filter or writing out values as a histogram may result in an incorrect default. You should change this setting only if you are certain that it is incorrect.
-
Select the statistic trace for generating the PDF on the Statistic Trace pull-down menu at the top of the dialog box.
The number of data points in the trace appears in the Number of data points field.
-
Enter the file name and number of data points for the generated PDF in the PDF file name and Number of sample points fields respectively. The default number of data points is 500.
-
Set the number of data points used by the Smooth operation in the Smoothing Window Size (points) edit field; the default is 3. (See "Smooth" on page 545 for more information.)