Using Network Difference Reports
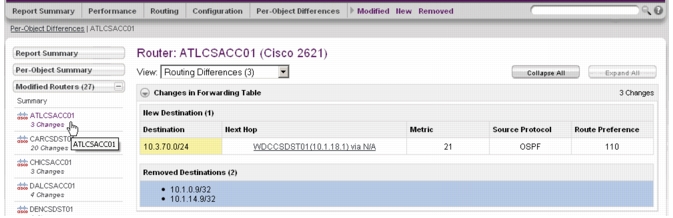
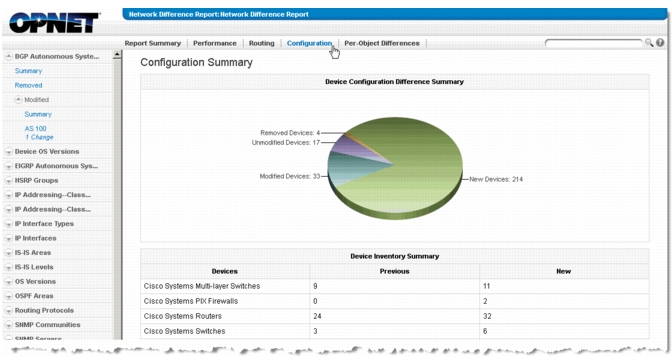
NetPlanner includes a Network Difference Report. Use the report to identify real-world or network differences between two network scenarios—such as network protocol and device configuration, performance, or routing differences, as shown in the following figure.
Figure 1: Example Network Difference Report
Key Concept—Network difference reports are useful when you want to know exactly how a network has evolved or how networks imported from different sources vary. You can also perform “what-if” studies using network simulations and use network difference reports to understand the overall impact on the network.
Specifically, the network difference report identifies:
- Device configuration changes
- Performance changes (e.g., utilization, delay, link subscription)
- Routing (e.g., flow path differences, new or removed next hops)
The network difference report also reports on change in logical groups such as BGP autonomous systems, EIGRP autonomous systems, and OSPF areas.
Note: Don’t confuse the Network Difference Reports with the Object/Attribute Difference Report. A Network Difference Report compares two scenarios and identifies only those differences that are likely to affect network behavior, such as differences in network device configurations or routing and performance. By contrast, an Object/Attribute Difference Report identifies all differences in objects and attributes, regardless of whether those differences affect network behavior.
Note: When you generate a network difference report, the presence of a network object is determined by comparing the host names of objects in both scenarios. An object is considered to be the “same object” in both scenarios if and only if the object has the same host name in both scenarios. This is true for nodes but not links and LSPs. These are identified by a combination of source/destination nodes and source/destination interfaces.
Preparing to Generate a Network Difference Report
In certain cases and for certain device types, you might need to set preferences to ensure that the network difference report produces the results you expect. This section describes the preparations you might need to make before running the network difference report.
Comparing Device Running Configurations or Device Startup Configurations and other Show Command Outputs
NetPlanner compares the running configurations from scenario to scenario by default. You can change the rule parameters to compare other show command output—such as the device startup configurations—or any show command output from devices that you collect CLI data from.
Tip: You can use NetCollector Device Drivers to create your own command types and collect any CLI data. NetCollector collects and archives the files so that you can import them with your topology and audit them using network difference reports.
Select the Configuration tab and specify the Show Command Outputs rule to compare any show command output from one scenario to the next.
For example, you can compare the show access-lists [list_name] command to see which ACL statements have been hit recently.
Important: Collect CLI data from the device by using the Device Driver wizard on NetCollector. When you configure the network difference rule parameters, you must specify whether you want to find the differences using the show command type or the show command name and then specify the exact string for the type or name that was configured on the NetCollector Device Driver wizard.
Generating a Network Difference Report
The three main options for generating a network difference reports are comparing the current scenario with:
- the previous version of the open scenario, which is useful if you have network models created using the Automation module.
- the latest version of the base scenario in the same project
- a scenario from a different project
Use the following procedure to generate a network difference report.
Procedure 1: Generating a Network Difference Report
-
Open one of the scenarios you want to compare.
Typically, you want to open the current scenario and compare it to the previous scenario.
-
Choose Scenarios > Network Difference Report > Generate Report….
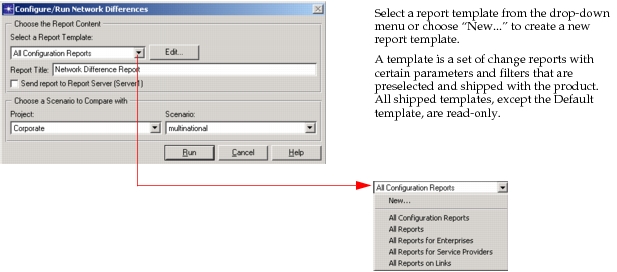
Result: The Configure/Run Network Differences dialog box appears.
Figure 2: Configure/Run Network Differences Dialog Box
-
Specify the requested information.
Table 1: Options for Configure/Run Network Differences Dialog Box
Option Description Report Title Specifies the title for the generated report. Send to Report Server Specifies to send a copy of the generated report to the Report Server, if one is specified. Select a Report Template Specifies the report template, that is, changes to be tested for and reported. See Figure 2. Edit... (optional, see step 4 below) Opens a dialog box in which you can specify the change reports that you want to generate. Also lets you specify parameters and filters for certain reports and parameters you want to run. Choose a Scenario to Compare with Project Indicates the project from which you want to choose the previous scenario against which to compare the new scenario. Scenario Specifies the previous scenario against which to compare the new scenario. Automation Used for generating difference reports using the Automation functionality. You must have an Automation license for this option to appear. -
(Optional) Click the Edit… button to specify reports and parameters for the Network Difference report.
Result: The Report Template dialog box opens (see Figure 3).
Figure 3: Customize Network DIfference Report Generation
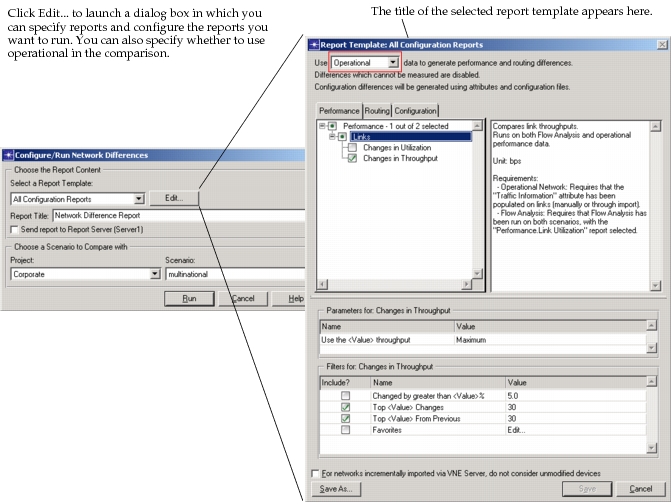
- Select the data source to be used for generating performance and routing differences between projects/scenarios from the drop-down menu..
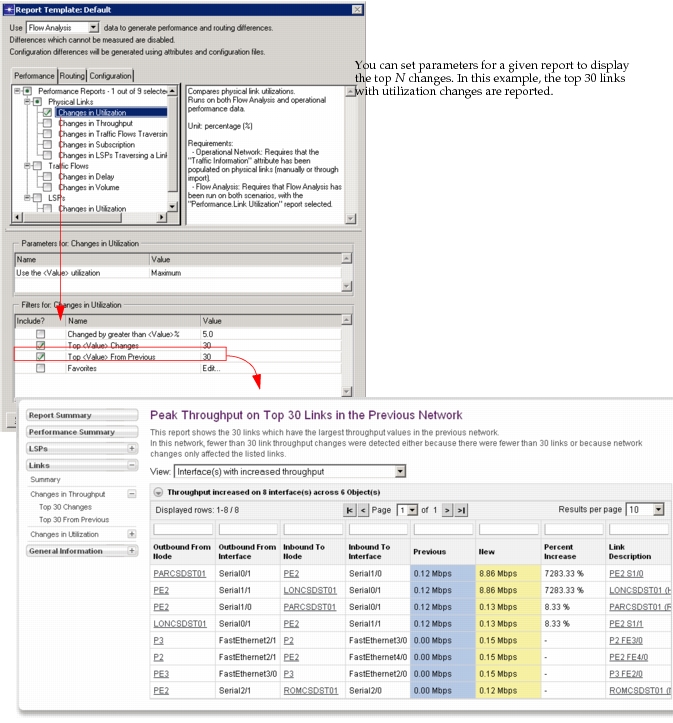
- Click on a tab to select the change reports to be generated and set the filters and parameters for Performance and Routing. Filters allow you to limit the number of objects reported (e.g., top 30 links with utilization changes). Favorites objects specified in a selection can be associated with a report as a filter to generate a focused report on certain objects of interest (devices, links, flows, LSPs). Parameters allows characterization of a report (e.g., Peak utilization changes versus 95th percentile utilization changes).
- Expand the treeview under each tab and specify the reports you want to run, as shown in Figure 4.
Figure 4: Specify Parameters for Network Difference Reports
Note: You can audit only changed devices when you configure a full import from NetCollector.
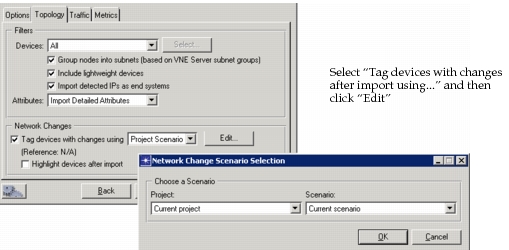
You must first configure the Network Changes section in the Topology tab of import from NetCollector, as shown in Figure 5.
-
Choose Topology > Import Topology > From NetCollector and then select the Topology tab.
-
Choose a Scenario that you want to compare to the current scenario by selecting “Tag devices with changes after import using...” and then clicking “Edit,” as shown in the following figure.
Figure 5: Auditing Changed Devices Only
-
Specify the Project and Scenario for comparison in the Choose a Scenario dialog box.
-
In the Network Differences Report Template parameters, choose "For networks imported via NetCollector, do not consider unmodified devices,” as shown in the following figure.
Figure 6: Auditing Changed Devices Only

-
You can then click “Save As” to save the settings to a new Report Template for subsequent use or “Save” to include your modified settings in the default Network Differences Report Template.
-
Click the Run button.
Result: The Network Difference Report opens in the web browser. For more information about the report, see Understanding the Network Difference Report.
For information about import from NetCollector options, see “Import from NetCollector Topology Tab“.
To view the most recently generated Network Difference Report, choose Scenarios > Network Difference Report > Launch Last Web Report.
Understanding the Network Difference Report
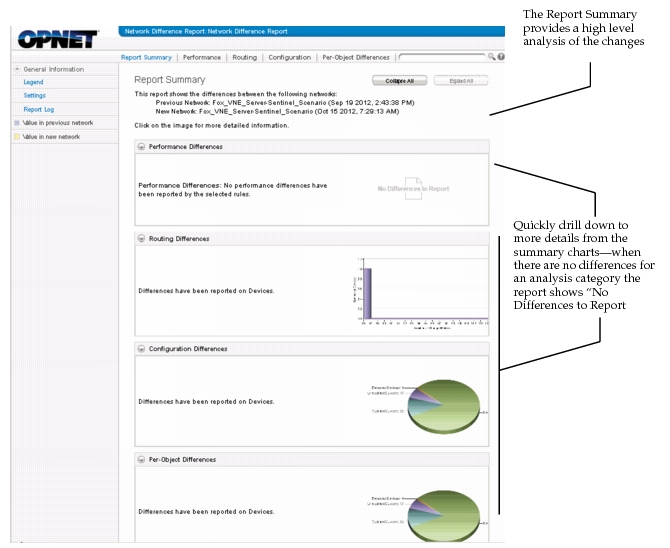
The Network Difference Report is an HTML report that provides a navigation bar in the header, left-pane navigation, and a contents pane on the right. Select a difference category from navigation bar in the header and then navigate through the results using the left pan.
Figure 7: Sample Network Difference Report
Search Field
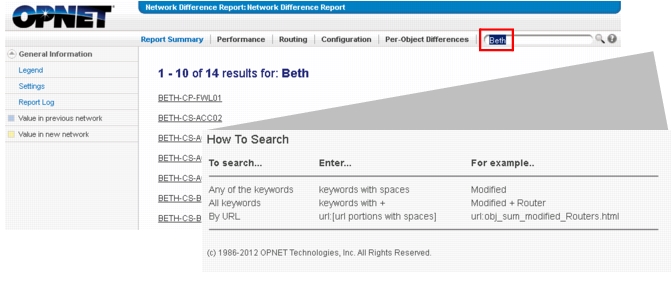
You can use a new Search field in the upper right-hand corner of the Network Difference Report. For example, typing "Beth" finds all pages in the current report with this string, as shown in the following figure.
Figure 8: New Web Report Search
Navigation in Banner
The banner includes “quick access” links as shown in the following figure.
Figure 9: Navigational Links in Banner

Table Data
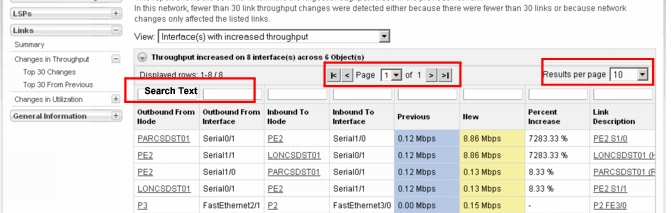
You can view table data in a page viewer, which you can use to select the results per page as well as search and sort in the column headings, as shown in the following figure.
Figure 10: Table Data
Drop-Down List Drill Downs
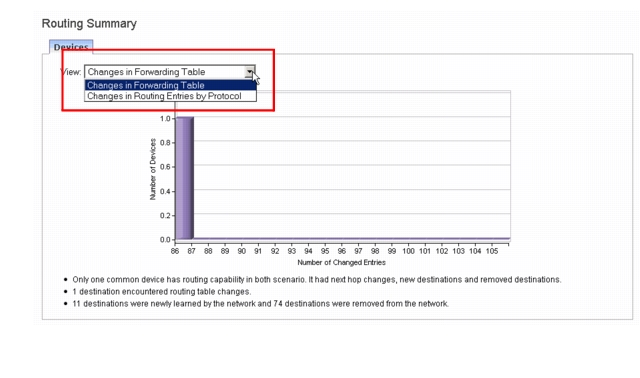
Use the tabs and drop-down lists to navigate to related network difference data, as shown in the following figure.
Figure 11: Drop-Down List Drill Downs
The Network Difference Report includes the following elements, as shown in Figure 7:
-
Navigation Bar in Report Header
- Performance Changes – Displays the changes to network performance (e.g., utilization, delay, or link subscription) between the previous and new scenarios. This tab has a high-level summary report using all objects present in previous and new scenarios (e.g., min/max utilization of all links in the previous network and those in the current network. This high-level summary report is categorized on a per-object type basis and can be accessed by clicking on the tab or on each of the object-types in the navigation pane.
- Routing Changes – Displays the changes to routing between the previous and new scenarios (e.g., default gateway changes, flow path differences, changes to hop-count).The top level summary reports on changes to routing tables between the two scenarios and also provides a brief summary on the status of flows and LSPs routed.
- Configuration Changes – Displays the changes to device configurations between the previous and new scenarios. The top level summary page provides a breakdown on the count of devices based on configuration changes.
- Per-Object Changes – Displays all (performance, routing, and configuration) changes between the previous and new scenarios by network object including devices, links, LSPs, and traffic flows. For example, a device can have configuration changes in OSPF as well as routing table changes, which can be seen together in the per-object page for that device. The top level summary page provides pie-charts for a breakdown on each object type based on all types of changes.
-
Left-pane Navigation – Contains links that let you navigate through the reports. Note that if you have configured Top N or Favorite reports, you can choose them from the list in this pane.
-
Contents pane – Displays the contents of the selected report
-
Summaries – Displays a graphical summary and overview of the reports contained in a tab
-
Settings – Displays the general settings used to generate the report, including the data source (operational network data), time interval between the previous and current scenario
-
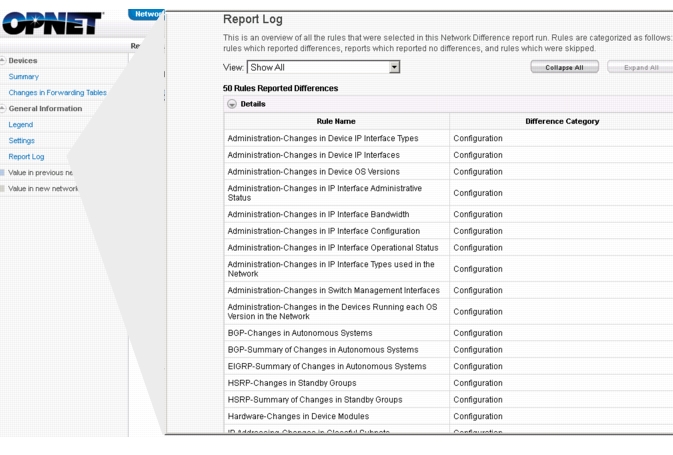
Reports log – Displays a summary of all rules run in a tabular format, including a list of devices with differences, a list of reports with no differences, and a list of skipped reports along with the cause and a suggested fix. See Figure 12 for an example.
Figure 12: Network Difference Reports Log
-
Changes Reports – Displays the output for the reports selected, as shown in the following figure.
Figure 13: Top N Reported Changes
Clickable hyperlinks in the report take you to per-object reports for the changes detected. In the report shown in Figure 14, notice that you can click on the type of per-object change you want to see in the navigation pane. In this case, modified routers are displayed. Hyperlinks provide easy navigation to object level changes from a network-level report. This lets you correlate impact and root cause analysis.
Figure 14: Network Difference Report with Hyperlinks to Per-Object Reports