Monitoring Simulation Progress
At the start of a discrete event simulation, a dialog box displays information about simulation progress and lets you control execution of the simulation. The specific dialog box that is opened (and thus the amount of information and control provided) depends on the current DES configuration mode, the number of runs configured, and whether the debugger (ODB) is active; see Table 76 for details.
Table 76: Simulation Monitoring Modes
| If the simulation was run from… | With… | And ODB is… | Simulation progress is monitored in… |
|---|---|---|---|
| Simple mode | 1 run | not used ¹ | Simulation Execution Dialog Box |
| Detailed or Advanced mode | 1 run | not used | Simulation Progress Dialog Box |
| 1 run | used | Simulation Progress Dialog Box Simulation Execution dialog box (advanced) Simulation console (advanced) |
|
| multiple runs | not used ¹ | DES Execution Manager |
Note 1: Simulation Debugger (ODB) is disabled in simple mode or when there are multiple runs.
Pauses for Prompting
If there are any unresolved parameters from a discrete event simulation, the simulation pauses and requests the necessary information, as shown in the following figure.
Figure 159: Dialog Box for Unresolved Attributes
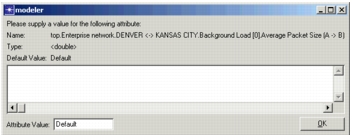
If the attr_prompt_mode preference is set to “console”, no dialog box appears. Instead, the prompt appears on the command line of the shell window from which Modeler was launched. Also, if the simulation was run from the command line rather than from the graphical user interface, prompts for undefined attributes appear on the command line.
The following example shows a typical command-line prompt:
-- Unset Environment Attribute --
* lan0.e1.src dest address: <integer>
* Desc:
* Press <return> to select default: -1

Enter value:
To avoid this interruption in the simulation process, you should define values for all promoted object attributes before running a simulation. You can do this on the Object Attributes page of the Configure/Run DES dialog box.
Simulation Execution Dialog Box
The Simulation Execution dialog box, shown in the following figure, displays basic information about the progress of a discrete event simulation and lets you control execution of the simulation. The displayed information includes elapsed time, simulation speed, and memory usage.
The Simulation Execution dialog box displays when you run a simulation in simple mode (des.configuration_mode preference set to “simple”) or when you click the Run button in the simple Configure/Run DES dialog box (Configure/Run DES Dialog Box (Simple)).
Figure 160: Simulation Execution Dialog Box
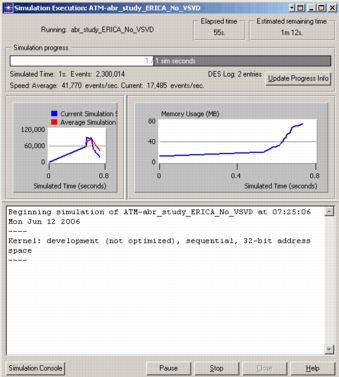
Discrete Event Simulation Statistics summarizes the simulation information displayed in this dialog box. Discrete Event Simulation Controls summarizes the controls. For information about the information panes, see the following topics:
You also can see descriptions of the information and controls by clicking the Help button in the Simulation Execution dialog box.
Simulation Progress Dialog Box
The Simulation Progress dialog box, shown in the following figure, displays detailed information about the progress of a discrete event simulation and lets you pause or stop execution of the simulation. The displayed information includes the basic information found in the Simulation Execution dialog box (elapsed time, simulation speed, and memory usage), plus a variety of tabbed pages containing more detailed information.
The Simulation Progress dialog box displays when you
- Run a simulation in detailed or advanced mode (des.configuration_mode preference set to “detailed” or “advanced”)
- Click the Run button in the detailed Configure/Run DES dialog box (Configure/Run DES Dialog Box (Detailed))
- Click the View Details button in the DES Execution Manager dialog box (DES Execution Manager)
Figure 161: Simulation Progress Dialog Box
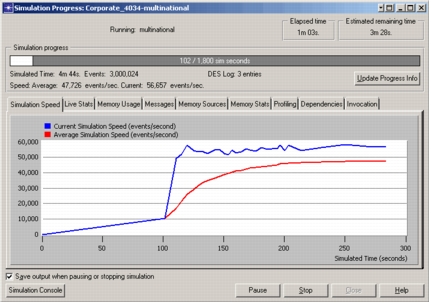
Discrete Event Simulation Statistics summarizes the simulation information displayed in this dialog box. Discrete Event Simulation Controls summarizes the controls.
The Simulation Progress dialog box displays numerous pages of additional information about the simulation. For descriptions of these tabbed pages, see the following topics:
- Simulation Speed Page
- Live Stats Page
- Memory Usage Page
- Messages Page
- Memory Sources Page
- Memory Stats Page
- Profiling Page
- Dependencies Page
- Invocation Page
- Next Steps Page
You also can see descriptions of the information and controls by clicking the Help button in the Simulation Progress dialog box.
Discrete Event Simulation Statistics
The information displayed in the Simulation Execution and Simulation Progress dialog boxes is updated at intervals of simulated time determined by the “Update interval” parameter on the Common page of the detailed Configure/Run DES dialog box. You can also click the Update Progress Info button to view current statistics.
The following table lists the statistics presented in each update.
Table 77: Simulation Statistics
| Statistic | Description |
|---|---|
| Running | Name of the scenario being simulated. |
| Elapsed time | Amount of real time used so far by the current simulation run. |
| Estimated remaining time | Estimated amount of real time until the current simulation is completed. |
| Simulation progress | Progress bar showing current simulation time as a fraction of total simulation duration. |
| Simulated Time | Current simulation time. |
| Events | Total number of events processed so far. An event usually signifies the arrival of a packet or an interrupt at a module, triggering some kind of response within the module. |
| Speed: Average | Average number of simulation events per second of real time (measured since the beginning of the simulation). |
| Speed: Current | Instantaneous number of simulation events per second (measured using real time over the last update interval). |
Discrete Event Simulation Controls
The Simulation Execution and Simulation Progress dialog boxes let you control execution of the current simulation. In the Simulation Progress dialog box, the controls appear on every tabbed page. The following table lists these controls in these dialog boxes.
Table 78: Simulation Controls
| Description |
|---|
| Update Progress Info button – Immediately updates the simulation statistics displayed in the dialog box. |
| Save output when pausing or stopping simulation checkbox – When selected, causes the simulation to save all statistics collected so far each time the simulation is paused or stopped. When unselected, statistics are saved only when the simulation completes. See Saving Simulation Output for details. (Not available in the Simulation Execution dialog box.) |
| Simulation Console button – Opens a dialog box showing status and error messages generated by the simulation program. See Simulation Console for details. |
| Pause button – Pauses the simulation that is currently running and optionally saves the statistics collected so far (see Saving Simulation Output for details). |
| Resume button – Resumes a simulation after it has been paused. |
| Stop Run button – Stops the current simulation run. (Called Stop in the Simulation Execution dialog box.) |
| Close button – Closes the dialog box. |
| Help button – Opens a help file for the dialog box. |
Saving Simulation Output
To save output whenever a simulation run is stopped, select the “Save output when pausing or stopping simulation” checkbox (this checkbox is selected by default). The output is saved in the output vector file that were specified for that particular simulation. To discard output when a simulation is stopped before completion, deselect this checkbox.
When the “Save output when pausing or stopping simulation” checkbox is selected, all statistics are written to the destination output vector file when you press the Pause button. This allows you to view results without waiting for the entire simulation to complete. You can view partial results for a simulation and decide whether to continue running that simulation or stop it. If you resume and complete the simulation, the temporary results are overwritten.
Simulation Speed Page
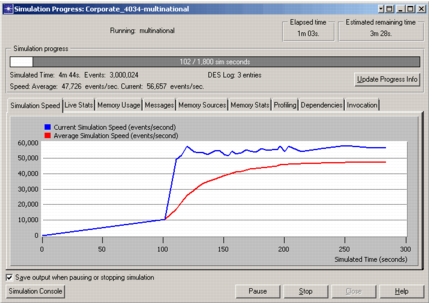
The Simulation Speed page displays a graph showing the current and average speeds of a simulation. This display appears as a pane in the Simulation Execution dialog box and as a tabbed page in the Simulation Progress dialog box.
Figure 162: Simulation Speed Page
Live Stats Page
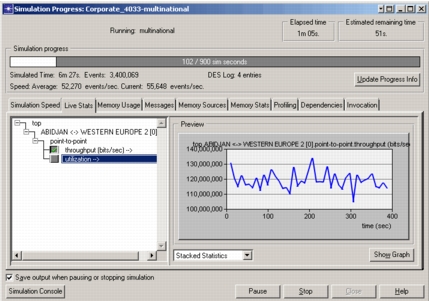
The Live Stats page shows a real-time graph of selected statistic values as the simulation runs. To view live statistics, you must enable collection of statistic values before running the simulation. See “Create Live Statistics Probe” on page 569 for details.
Figure 163: Live Stats Page
Memory Usage Page
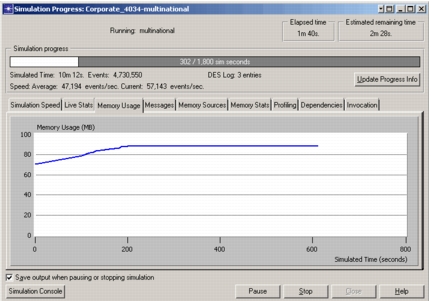
The Memory Usage page displays a graph of memory usage versus simulation time. This display appears as a pane in the Simulation Execution dialog box and as a tabbed page in the Simulation Progress dialog box.
Use the Memory Usage page of the detailed Configure/Run DES dialog box to enable this feature.
Figure 164: Memory Usage Page
Note: The way memory usage is reported on the Memory Usage page depends on the setting of the “mem_optimize” preference.
Click the Help button in the Simulation Execution or Simulation Progress dialog box for details about this page.
Messages Page
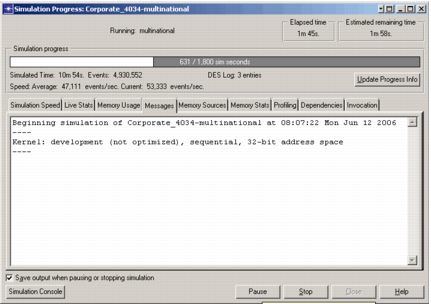
The Messages page displays messages that show the progress of a simulation, beginning with the initialization stages and continuing with run-time simulation statistics. This display appears as a pane in the Simulation Execution dialog box and as a tabbed page in the Simulation Progress dialog box.
Figure 165: Messages Page
Two common types of messages appear here:
- Successful Termination – If the simulation runs successfully to its conclusion, a message displays, similar to that shown in Figure 165.
- Abnormal Termination – If the simulation run terminates abnormally, a message displays. The “op_vuerr” program mentioned in the display is a supplied program that can be run from the command line. The op_admin subdirectory mentioned in the error message is located in the user’s home directory.
Memory Sources Page
The Memory Sources page displays detailed information about all managed memory blocks in current use. The information is organized as a treeview of all unique function call stacks (FCSs) that have allocated currently active memory blocks.
Use the Memory Usage page of the Configure/Run DES dialog box to enable this feature and specify memory categories to be traced.
Note: Memory source information is available only while the simulation is running. We recommend that you pause the simulation before examining memory usage details through this page.
Figure 166: Memory Sources Page
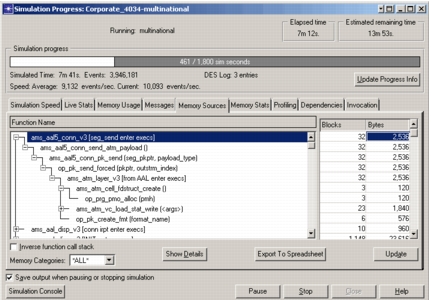
The Show Details button opens a dialog box with details about all individual memory blocks allocated by the selected FCS in the highlighted row of the Memory Sources treeview.
Figure 167: Memory Blocks Dialog Box
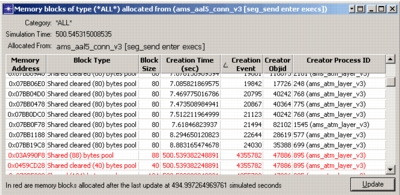
Click the Help button in the Simulation Progress dialog box for more details about the Memory Sources page.
Memory Stats Page
The Memory Stats page displays memory statistics during a simulation. Use the Memory Usage page of the Configure/Run DES dialog box to enable this feature and specify when data is generated.
Note: The way memory usage is reported on the Memory Stats page depends on the setting of the “mem_optimize” preference.
Figure 168: Memory Stats Page
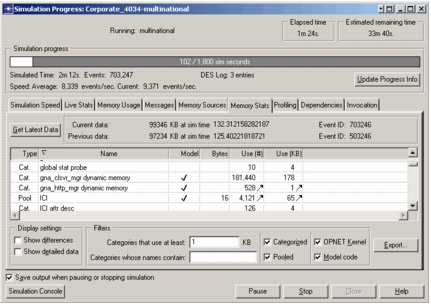
Click the Help button in the Simulation Progress dialog box for more details about this page.
Profiling Page
The Profiling page displays profiling information for functions used in the simulation code, as shown in the following figure. To see this display, you must enable collection of profiling information on the Profiling page of the Configure/Run DES dialog box and direct output to the simulation progress window.
Figure 169: Profiling Page
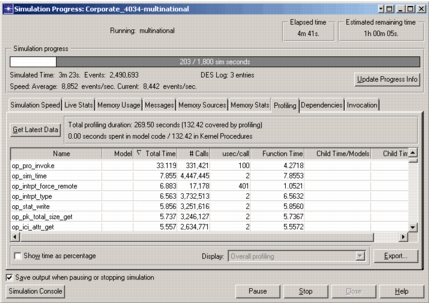
Click the Help button in the Simulation Progress dialog box for more details about this page.
Dependencies Page
The Dependencies page shows a list of files that were accessed using Riverbed APIs during the discrete event simulation. In addition, it lets you package all or a subset of these files in a component file archive. See Component File Archive for details.
Figure 170: Dependencies Page
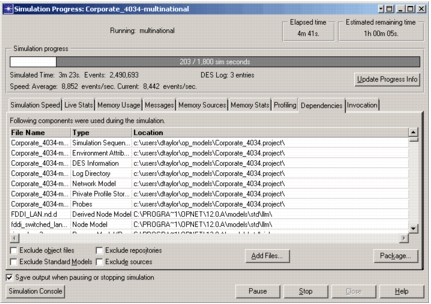
Click the Help button in the Simulation Progress dialog box for more details about this page.
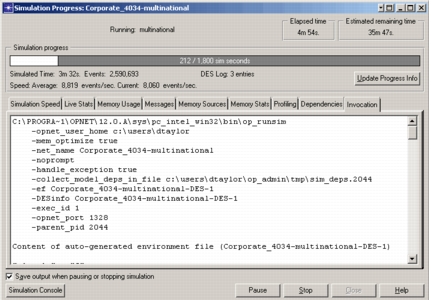
Invocation Page
The Invocation page shows the invocation parameters of the current simulation. These parameters include the command used to run the simulation program (usually op_runsim) and the content of the special environment file generated for the simulation. This environment file contains a list of preferences based on the settings defined in the Configure/Run DES dialog box.
Figure 171: Invocation Page
Next Steps Page
The Next Steps page provides quick access to various kinds of simulation results you are likely to want. It opens automatically after a simulation has completed.
Figure 172: Next Steps Page
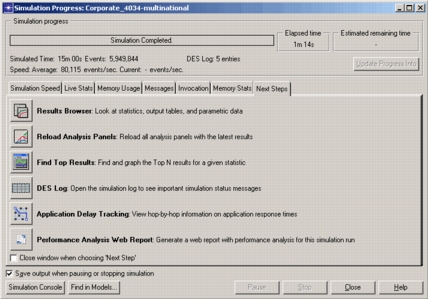
Click one of the icons to open the associated item. The Simulation Progress dialog box will remain open for further selections unless you select the “Close window when choosing 'Next Step'” checkbox.
You can control the behavior of the Next Steps page with the “des.close_after_next_step” and “des.show_next_steps” preferences.
Simulation Console
The Simulation Console is a text window containing status, simulation progress, and error messages generated by the simulation program. To view the Simulation Console, click the Open Console button in either the Simulation Execution or Simulation Progress dialog box.
Figure 173: Simulation Console
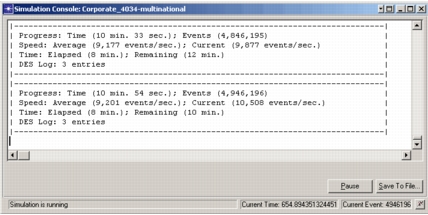
Table 79: Simulation Console Controls
| Control | Description |
|---|---|
| Message display | Displays status, simulation progress, and error messages generated by the simulation program. |
| Pause/Resume button | Toggles between Pause and Resume to control simulation execution. - Pause – Causes the simulation to pause at the end of the currently executing simulation event. - Resume – Causes the simulation to resume execution. |
| Save To File button | Saves the contents of the Simulation Console message display to a text file. |
| Status display | Shows the status of the simulation. |
| Current Time display | Shows the current simulation time. |
| Current Event display | Shows the ID of the most recently completed simulation event. |
DES Execution Manager
The DES Execution Manager dialog box lets you monitor the status of multiple simulations. It appears in place of the Simulation Progress dialog box when you run a simulation sequence that contains multiple simulation sets or simulation runs.
Figure 174: DES Execution Manager
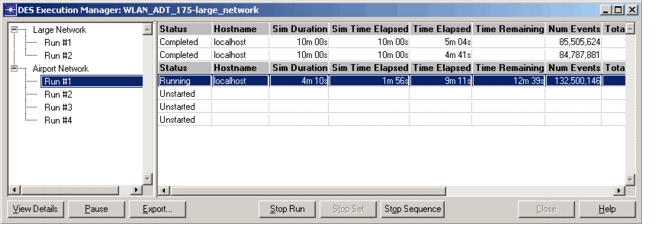
The left pane of the DES Execution Manager contains a treeview that lists the simulation sets and runs that will be executed. Simulation sets that contain multiple runs can be expanded to show each run. The right-hand pane shows the status of each simulation as it is executed.
You can open a Simulation Progress dialog box for any running or completed simulation by selecting it and clicking the View Details button (see Simulation Progress Dialog Box).
You can save the information shown in the dialog box to a tab-delimited text file by clicking the Export button. Other buttons let you pause and resume a running simulation or stop a run, a set, or the entire sequence.