Viewing SLA Violations
If you applied a service level agreement (SLA) to the scenario and the graph displays a statistic covered by the SLA, violations of the SLA will be shown.
Violations are shown in the following types of graphs:
If you check the Use Compliance Colors item in the graph pop-up menu, graphs are color-coded (or patterned on monochrome displays) to indicate compliance or non-compliance with the SLA. See "Pop-Up Menus" on page 115 for information about this menu.
For more information about service level agreements, see Defining a Service Level Agreement.
Statistic Graph
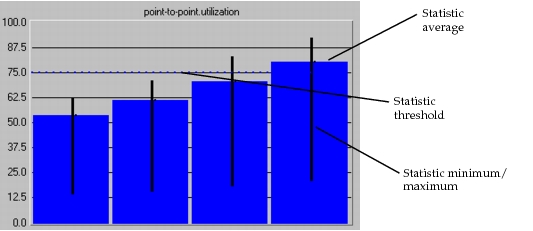
The statistic graph shows three distinct pieces of information about the statistic:
- Statistic threshold. A horizontal line shows the threshold specified in the SLA for the statistic. The average value of the statistic during any particular time period (or bucket) should comply with this threshold value.
- Statistic average. The bar shows the average of all values collected for a statistic during a particular time period.
- Statistic minimum/maximum. The vertical line shows the range of values collected for a statistic during a particular time period.
Figure 123: Statistic Graph
Percent Compliance Graph
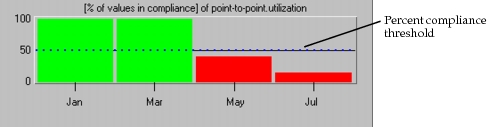
The percent compliance graph shows two pieces of information about the statistic:
- The percent compliance threshold defines the percentage of data points within a particular time period that must conform to the statistic threshold for that time period. For this example, the percent compliance threshold was set to 80 percent. This means that for each time period, more than 80 percent of the data points collected for a single period must be above the 75 percent utilization statistic threshold for the time period to be in compliance with the SLA.
- Percent compliance by bucket. This information is color-coded:
- A bucket in compliance with the statistic threshold is green.
- A bucket that is a “close call” is yellow. “Close call” means that the bucket complies with the SLA, but is less than some margin above the compliance threshold. This margin is calculated as follows:
- margin = 10% * (100% - percent compliance threshold)
- A bucket in violation of the statistic threshold is red.
Figure 124: Percent Compliance Graph