Edit Graph Properties
This operation, located on the Graph pop-up menu, allows you to edit the properties that affect how the graph and the statistics in it are displayed. These properties do not change the data, only the manner in which it is displayed.
Figure 146: Edit Graph Dialog Box
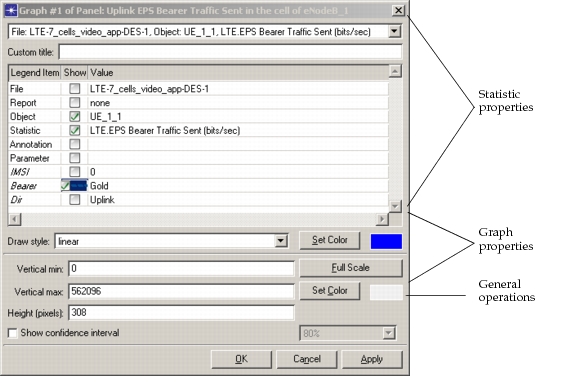
The Edit Graph dialog box is divided into three sections, as shown in Figure 146. Each section deals with a different aspect of the graph. The following tables list the fields in each of the three sections.
Table 66: Statistic Properties
| Name | Description |
|---|---|
| (Active Statistic) | The first field specifies the statistic on which all statistic operations will be performed. The pull-down menu lists all statistics in the graph. |
| Custom title | A user-specified custom title. If a custom title is supplied, the file, report and parameter values will not appear in the graph. |
| Legend | A table of items that can be displayed in the legend for the statistic. • File – Name of the current file. • Report – Name of the report that collected this statistic, if any. • Object – Name of the object from which this statistic was collected, if any. • Statistic – Name of the current statistic. • Annotation – An annotation that can be printed above the graph. • Parameter – Text of a parameter label, if desired. • Tags – Each tag that is defined for the statistic. You can use the Show checkbox to specify whether an item is included in the legend and edit the Value cell to change the default text. |
| Draw style | Specifies the draw style for the active statistic. |
| Set Color [button] | Lets you specify the color of the active statistic and its vertical label. |
| Show [checkbox] | When selected, the corresponding label is displayed in the panel. |
Table 67: Graph Properties
| Name | Description |
|---|---|
| Vertical Min | Specifies the minimum vertical value for this graph. Default is smallest vertical value of any data point in this graph. |
| Vertical Max | Specifies the maximum vertical value for this graph. Default is largest vertical value of any data point in this graph. |
| Height (pixels) | Specifies the height of the graph in pixels. |
| Full Scale [button] | Restores the default vertical values for this graph. |
| Legend [button] | Shows the ordinate value assigned to each drawing style in the enumerated vector dictionary. |
| Set Color [button] | Specifies the color of the plotting area. |
| Show Confidence Interval [checkbox] | When selected, provides access to the nn% Confidence Interval pull-down menu. |
| nn% Confidence Interval | Specifies the confidence interval level as a percentage. This menu is available only when the Show Confidence Interval checkbox is selected. |
Table 68: General Operations
| Name | Description |
|---|---|
| OK [button] | Applies current options to the analysis panel and closes the Edit Graph dialog box. |
| Cancel [button] | Closes the Edit Panel dialog box without making further changes to the analysis panel. Changes made previously by the Apply button are not undone. |
| Apply [button] | Applies current options to the graph without closing the Edit Graph dialog box. |