Parametric Studies
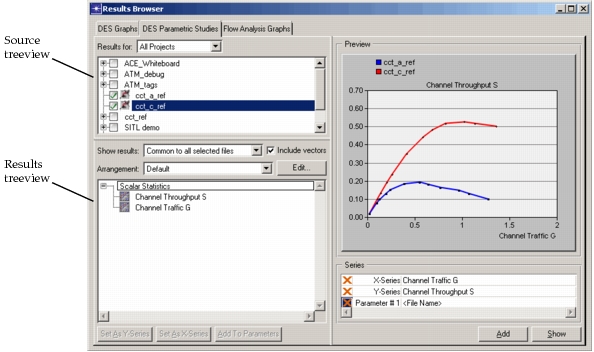
A parametric study examines results for the same statistic from different scenarios or from various runs of the same traffic growth simulation. It also can be used to examine the effect on one statistic as another is changed in the same scenario. You perform a parametric study from the Parametric Studies page of the Results Browser.
Figure 115: Results Browser—Parametric Studies Page
Procedure 144: Creating a Parametric Analysis Panel
-
Open the Results Browser.
-
Click the DES Parametric Studies tab.
The Parametric Studies page appears.
-
Compare two statistics:
3.1 From the “Results for:” pull-down menu, choose whether to look at the current scenario, the current project, or all results in the computer’s model directories.
3.2 Select the desired source files in the source (top) treeview.
3.3 From the “Show results:” pull-down menu, choose which results to consider:
- Common to all selected files – only results that appear in every source file
- Found in any selected files – every result found in at least one of the source files
3.4 Use the “Include vectors” checkbox to specify which kinds of results to include in the results treeview. When this checkbox is selected, both vector and scalar results are included. When unselected, only scalars are shown.
3.5 If desired, use the “Arrangement:” pull-down menu to change the hierarchy of the results treeview:
- Choose a saved arrangement. If none of the available arrangements meets your needs, follow the Defining an Arrangement for the Results Browser procedure to define a new arrangement.
3.6 In the results (bottom) treeview, select a statistic to be plotted on the vertical axis. Then click the Set As Y-Series button.
The statistic is drawn in the Preview pane. Note that the x-axis is labeled Experiment #, representing the different simulation runs for which statistic values are available.
3.7 In the results (bottom) treeview, select a statistic to be plotted on the horizontal axis. Then click the Set As X-Series button. (Alternatively, right-click on the Series table to use a file, scenario, or project name on the x-axis.)
The Preview pane now shows values of the second statistic on the x-axis.
-
Add additional parameters to the graph:
4.1 In the source (top) treeview, select one or more additional sources for statistics (if necessary).
4.2 Right-click on the Series table (below the Preview pane) to use a file, scenario, or project name as a parameter. (Or, to use a statistic, select the statistic in the results (bottom) treeview and click the Add To Parameters button.)
The Preview pane now shows traces for each parameter value.
-
Click the Show button.
An analysis panel opens with the parametric study results. The Results Browser remains open. You can right-click on the analysis panel or graph to edit their appearance.