Tracking Application Delays
Application Delay Tracking (ADT) is an advanced feature that helps you identify the sources of application delay in a discrete event simulation. With ADT, you can follow each packet of an application message throughout the simulated network, examining sources of delay in each segment of its path. You can use this feature to answer questions such as:
- What are my slowest applications?
- Did my application spend more time processing at the application layer or in the network?
- What intermediate nodes or links were the largest bottlenecks?
- Where were application packets dropped?
You can use the data captured by ADT in two ways:
- View the results directly in the Application Segment Tracking Viewer. This approach can identify application performance problems that elude diagnosis with higher-level (and thus easier-to-use) tools such as AppDoctor. However, because ADT works on the lower levels of network behavior, you must have an in-depth understanding of the applications involved and be able to recognize unreasonable behavior to make good use of this feature.
- Export the data to Transaction Analyzer for analysis. This approach lets you use the advanced set of tools in Transaction Analyzer on simulation results just as you would for real-world captured traffic. With Transaction Analyzer analysis, you can quickly understand the causes of delays, produce high-quality automated reports, and so on.
Application Delay Tracking captures a lot of data and its data file quickly grows very large. Thus, you should be selective about its use. Limit the objects on which ADT is enabled and the duration over which it operates. Also, note that ADT will slow down execution of a simulation considerably.
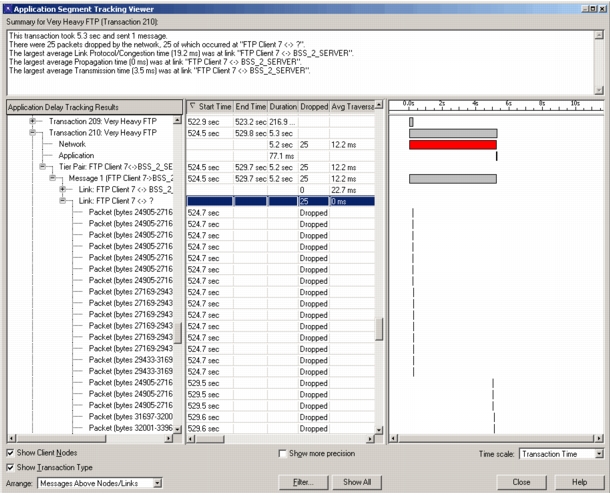
The following figure presents a sample use of Application Delay Tracking. In this figure, the Application Segment Tracking Viewer shows a message that had rapid WLAN retransmissions interspersed with slower TCP retransmissions (which highlights the exponential back-off behavior in TCP).
Figure 113: Application Segment Tracking Viewer
Model Support for Application Delay Tracking
The following models support Application Delay Tracking:
- Application models
- Custom application
- Standard applications (database, email, FTP, HTTP, print, remote login, video conferencing, voice, peer-to-peer file sharing)
- Transaction Analyzer
- Broadcast/wireless MAC models
- LTE
- WLAN
You can use the KPs in the “Application Delay Tracking Package” to add support for Application Delay Tracking to your custom models.
Workflow for Tracking Application Delays
The following steps outline a general workflow for viewing application delays in a network.
- Enable Application Delay Tracking for selected workstations and applications.
- Run a discrete event simulation to generate ADT data.
- Analyze the results.
For the GNA models included in the Standard Model Library, workstation nodes have an attribute that supports tracking for individual application profiles. You use this attribute to enable ADT, as described in the following procedure.
Procedure 139: Enabling Application Delay Tracking
- Right-click on a workstation for which you want to generate data. Choose Edit Attributes.
- Expand the Attribute tree to Applications > Application: Supported Profiles.
- Expand each application profile you want to track and set the Application Delay Tracking attribute to Enabled.
- (Optional) To reduce the size of the resulting ADT data file, set one or more of the following sub-attributes:
- Application Delay Tracking > Start Time (seconds)
- Application Delay Tracking > End Time (seconds)
- Application Delay Tracking > Sample Every N Applications
- Application Delay Tracking > Maximum Samples
- Click OK.
- If desired, repeat steps 1–5 to enable Application Delay Tracking on additional workstations.
After enabling Application Delay Tracking on each workstation of interest, run the discrete event simulation. An Application Delay Tracking (*.adt) data file is generated in your primary model directory. This file contains tracking data for all enabled profiles. You can change the data file directory when you configure the simulation (see Changing the Data Directory for Application Delay Tracking).
After the simulation completes, open the results in the Application Segment Tracking Viewer for analysis. To open the viewer with the latest simulation results, do one of the following:
- Click the Application Delay Tracking button on the Next Steps page of the Simulation Progress dialog box.
- Choose DES > Results > View Application Delay Tracking.
Note: You can also open the viewer with older ADT data: choose DES > Results > View Application Delay Tracking… and locate the desired .adt file in the file browser.
The Application Segment Tracking Viewer uses a treeview to organize tracking data and has two panes that show the tracking data in tabular and graphical form. By navigating the treeview, you can see information such as
- The breakdown of transaction times into application vs. network delay
- The duration of individual message transfers, and the message processing times at individual links and nodes
- Protocol, transmission, link, and congestion delay times for individual packets
A typical workflow for analyzing results is to
- View summary information for application transactions.
- Sort to find the slowest application transactions.
- Filter out unneeded application transactions, if any.
- Identify bottlenecks in the network. To do this, drill into transactions of interest to identify the slowest links and nodes, those with the most dropped packets, and so on.
- To further analyze a transaction, export the data to Transaction Analyzer.
Procedure 140: Exporting ADT Data to Transaction Analyzer
-
In the Application Segment Tracking Viewer, right-click on a transaction and choose “Export to AppTransaction Xpert” from the pop-up menu.
One .csv file is created for each tier in the ADT data and the transaction opens automatically in Transaction Analyzer.
If the transaction does not open automatically, do the following:
1.1 In Transaction Analyzer, choose File > Open Packet Traces > In Transaction Analyzer (Simultaneous Captures).
1.2 Add the .csv files from ADT.
-
Choose AppDoctor > Refine Network Effects and set the bandwidth between segments to match the network model.
-
Use Transaction Analyzer to analyze the trace.
Application Delay Analysis Techniques
The Application Segment Tracking Viewer gives you control over what Application Delay Tracking data you see and how it is organized. This control makes it easier to analyze the data and identify the probable causes of application delays.
Sorting
Sorting lets you arrange the displayed data in the most useful order for your analysis.
- Use the Arrange pull-down menu to organize the data hierarchy:
- To examine delays by message, choose Messages Above Nodes/Links
- To examine delays by link segment, choose Nodes/Links Above Messages
- Click on a column head in the data table to sort the data based on column values.
- Use the Time scale pull-down menu to adjust the zoom level of the graphical display:
- To view transactions relative to the entire simulation, choose Simulation Time
- To zoom in on a transaction and see transaction delays, choose Transaction Time
- To zoom in on a packet and see packet delays, choose Packet Time
Filtering
Filtering lets you remove unneeded transactions from the viewer. Click the Filter… button to remove transactions based on name, client name, start time, duration, number of messages, and message duration.
- To show only those transactions that exceed a defined Service Level Agreement (SLA), filter by transaction duration.
- To show outliers (transactions with messages whose duration differs significantly from some standard), use the last filter option.
Filter actions are cumulative. That is, the filter actions in the Application Delay Tracking Filter dialog box operate on the data shown in the Application Segment Tracking Viewer, not on the entire data set. This approach lets you iteratively reduce the displayed data until you have only what you need for analysis. The Show All button restores the entire data set to the viewer.
Application Delay Tracking Color Scheme
The delay graphs in the Application Segment Tracking Viewer use a color code to identify the source of delays. These color codes are
- Yellow – tier processing
- Red – network latency
- Green – network bandwidth
- Blue – network congestion and protocol
Changing the Data Directory for Application Delay Tracking
The default location for Application Delay Tracking data files is your primary model directory. Use this procedure to change the default location.
Procedure 141: Changing the Data Directory for Application Delay Tracking
- Choose DES > Configure/Run Discrete Event Simulation.
- Go to the Inputs > Global Attributes page.
- Set the Applications > Application Tracking Directory attribute to the desired directory path.