Report Showcase
The Report Showcase lets you add reports (e.g., flow analysis, design actions) to a dock, which appears in the bottom third of the Project Editor, as shown below. This showcase keeps the reports of interest handy for ready access to information.
Figure 18: Report Showcase in Project Editor

The following Report Showcase capabilities are described in this section:
- Adding Reports to the Report Showcase
- Opening the Report Showcase
- Highlighting an Object in the Project Editor from the Report Showcase
- Context Menu Options in Report Showcase
Adding Reports to the Report Showcase
Before you can view and use the Report Showcase, you must add reports to it. You can add reports to the showcase in two ways:
Add a Report from the Results Browser
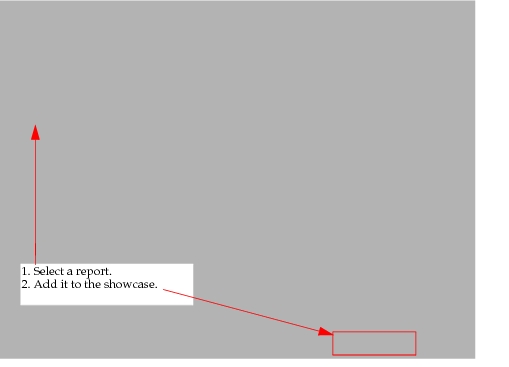
To add a report to the showcase, select a report in the Results Browser and click the “Add to Report Showcase” button. This action will also launch the Report Showcase in the Project Editor.
Figure 19: Adding a Report to the Showcase from the Results Browser
Add an Individual Report
You can also add an individual report to the Report Showcase from a menu option, as shown. Note that in the example below, we have opened the Demand Routing report for a given demand. If we want to see this report in the showcase, we can use the File > Add to Report Showcase menu option. This action will also launch the Report Showcase.
Figure 20: Adding an Individual Report to the Showcase

Opening the Report Showcase
To open the Report Showcase at any time, use the View > Show Report Showcase menu option. This menu option is a toggle, so you can select it again to close the Report Showcase.
Figure 21: Opening the Report Showcase from the View Menu

Highlighting an Object in the Project Editor from the Report Showcase
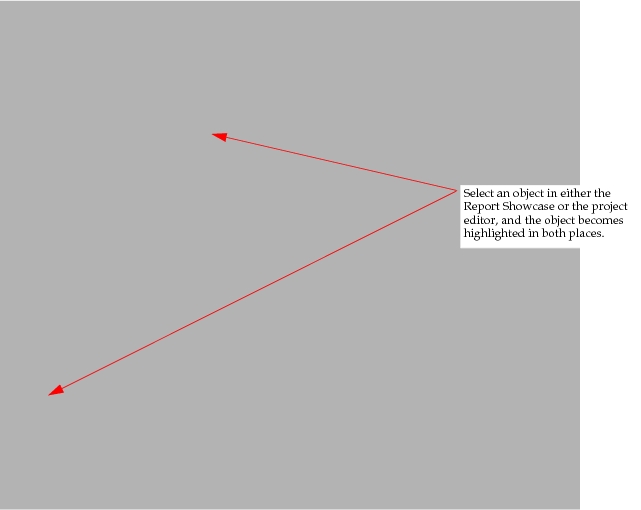
From the Report Showcase, you can select an object in a report and highlight the object in the Project Editor. Likewise, you can select an object in the Project Editor, and the object becomes highlighted in all open reports in the Report Showcase. This capability makes it easier for you to find objects in your network model.
Figure 22: Highlighting an Object in the Project Browser from the Report Showcase
Context Menu Options in Report Showcase
Within the Report Showcase, you can perform several actions in the context menu, which opens when you right-click on a tab, as shown below. This menu allows you to work with the reports outside the Results Browser. For example, you can “Reload” the current tab or “Reload All” tabs, which updates the report content when you have made changes in the project.
Figure 23: Report Showcase Context Menu

Note: For user-defined reports, the values in the report will update automatically when you make changes to the report, so you do not have to use the Reload commands with a user-defined report.