Performance Analysis Web Report
Performance Analysis web reports provide insight into the results of your network simulations. With these reports, you can view intelligent, network-wide summaries of operational performance data for selected metrics.
Figure 128: Performance Analysis Web Report
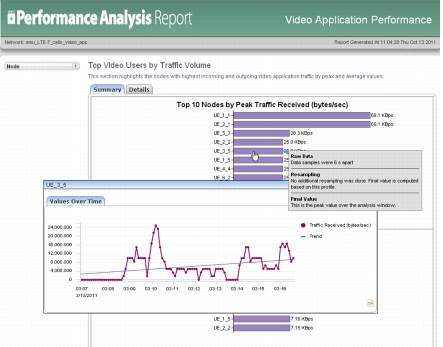
Modeler comes with predefined report templates containing charts and tabular data for commonly needed analyses, such as application performance and LTE metrics. For a quick analysis, you can simply select one of the predefined templates before you run a simulation (Procedure 162 Generating a Performance Analysis Web Report Automatically).
If you want to perform a specialized analysis, you can create a custom report template. You can specify what metrics are shown, which network objects are considered, the page layout, and other aspects of the report.
The general workflow for a custom Performance Analysis web report is:
- Define a Performance Analysis web report template. (Defining a Performance Analysis Web Report Template)
- If desired, customize the report. (Customizing a Performance Analysis Web Report Template)
- Generate the report. (Generating a Performance Analysis Web Report)
- View the report. (Viewing Performance Analysis Web Reports)
Anatomy of a Performance Analysis Web Report
Performance Analysis web reports use pages and entries to organize analyses of your network simulation results.
Pages provide high-level organization of report content. They let you group results into related areas. For example, Figure 129 shows a report that uses pages to organize results by transmitted and received traffic volumes, contention, end-to-end delay, and QoS. Each page can contain one or more entries.
Figure 129: Parts of a Performance Analysis Web Report
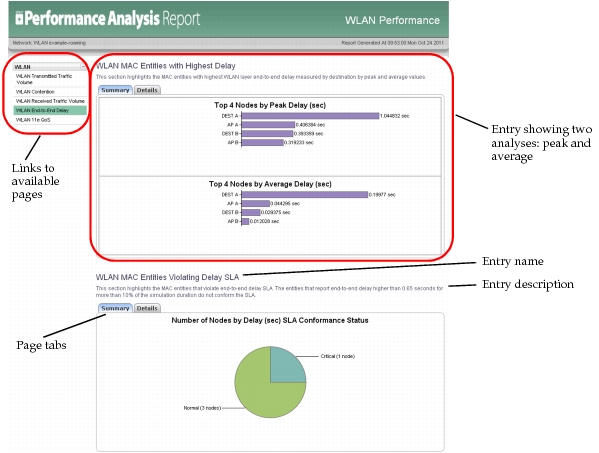
An entry applies to one or more specific metrics and can present different analyses (such as peak or average statistics) for each metric. An entry might appear several times in a report, with each instance having a different display type (such as bar chart or table) and appearing on different pages or under different user-defined tabs. The content and appearance of an entry is determined by a variety of associated settings:
- Display profile – defines the appearance of the entry (type of chart or table, labels, colors, and so on) and which statistics appear in it
- Entry information – defines the entry name, component type (node or link), and a description of the entry
- Analysis profile – defines how a metric will be analyzed (which determines what statistics will be available for display)
- Filtering profile – defines which components will be considered for analysis, based on characteristics such as data thresholds or machine types
- Grouping profile – defines how components should be grouped for analysis and reporting as aggregates, based on characteristics such as site or name
Customizing a Performance Analysis Web Report Template
The following table lists some of the customizations possible and directs you to the procedures for making those changes.
Table 63: Guide to Customizing Performance Analysis Web Reports
| To Change… | Refer to… |
|---|---|
| which pages are included in a report or the order in which they appear | Managing the Pages in a Report |
| the title or contents of a page | Creating or Customizing a Page |
| the name or description of an entry | Creating or Customizing an Entry |
| which entries are included on a page or the order in which they appear | Managing the Entries on a Page |
| how network components are chosen for inclusion in the report | Filtering Profile |
| how network components are aggregated for analysis | Grouping Profile |
Archiving a Performance Analysis Web Report Template
In some cases, you might need to share a report template that you modified or created with a colleague or submit it to Riverbed Technical Support. You can use the Archive feature to store a copy of all files associated with a particular Performance Analysis web report template.
Procedure 155: Archiving a Performance Analysis Web Report Template
- In the Generate/Configure a DES Report dialog box, click the Archive button.
- In the file browser, choose a location to save the archive file.
- Click OK to create the Archive.