Working with Report Entries
Entries define the information that appears in a Performance Analysis web report. They specify what metrics are reported and how those metrics are analyzed, filtered, and grouped. Modeler provides an entry dialog to help you specify this information.
Creating or Customizing an Entry
Use the following procedures to create a new entry or modify an existing one.
Procedure 159: Creating an Entry
-
If necessary, open the “Customizing
<page>” dialog box. -
In the Page Content area, click the “Create a new entry” button (
 ).
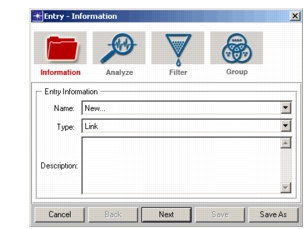
The Entry dialog box opens to the Information page.
-
Leave the Name field set to New… (you will name the new entry when you save it).
-
In the Type field, select whether this entry will use node or link statistics.
-
Enter a description of the entry. This text will appear above the entry in the generated report.
-
Click Next.
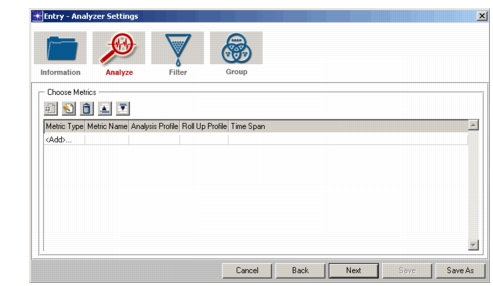
The Entry dialog box advances to the Analyzer Settings page.
-
For each metric to be included in this entry, do the following:
7.1 In the Metric Type cell, click
<Add>… and select a statistic.7.2 (Optional) Change the default Metric Name to the name you want to have displayed in reports.
7.3 Click in the Analysis Profile cell and select the profile you want to use for analyzing the statistic. See Analysis Profile for more information.
7.4 Keep the default settings for Roll Up Profile and Time Span.
-
When you have added all desired metrics, click Next.
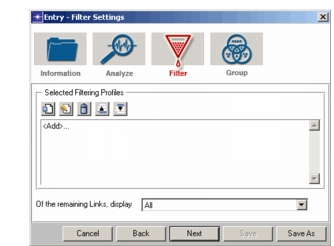
The Entry dialog box advances to the Filter Settings page.
-
(Optional) Click
<Add>… and select a filtering profile to use. Repeat to add additional filtering. See Filtering Profile for more information. -
When you have specified all desired filtering, click Next.
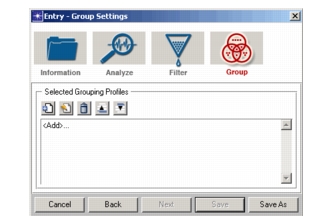
The Entry dialog box advances to the Group Settings page.
-
(Optional) Click
<Add>… and select a grouping profile to use. Repeat to add additional groupings. See Grouping Profile for more information. -
When you have specified all desired groupings, click Save As.
-
Specify a location and name for the entry, then click Save.
Procedure 160: Customizing an Entry
-
If necessary, open the “Customizing
<page>” dialog box. -
In the Page Content area, right-click an entry name and choose Customize from the pop-up menu.
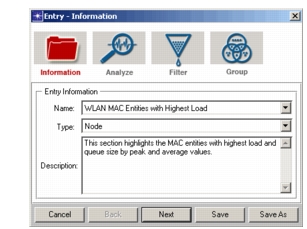
The Entry dialog box opens to the Information page.
-
Leave the Name field as is (if desired, you can rename the entry when you save it).
-
Leave the Type field as is, unless you will be changing the type of statistics this entry uses.
-
(Optional) Enter a description of the entry. This text will appear above the entry in the generated report.
-
Click Next.
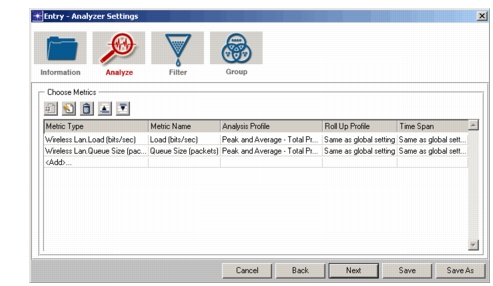
The Entry dialog box advances to the Analyzer Settings page.
-
For each metric to be modified, do one or more of the following:
To delete a metric or change its order:
- Right-click the metric and choose Remove, Move Up, or Move Down.
To change a metric type:
- Click the Metric Type cell and select a new statistic.
To change a metric name:
- Click in the metric cell and enter a new name.
To modify an analysis profile:
- Click in the Analysis Profile cell and select a new profile, or right-click the cell and choose Customize. (See Analysis Profile for customization details.)
To add a metric:
7.1 In the Metric Type cell, click
<Add>… and select a statistic.7.2 (Optional) Change the default Metric Name to the name you want to have displayed in reports.
7.3 Click in the Analysis Profile cell and select the profile you want to use for analyzing the statistic. See Analysis Profile for more information.
7.4 Keep the default settings for Roll Up Profile and Time Span.
-
When you have modified all desired metrics, click Next.
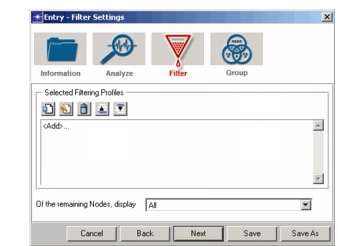
The Entry dialog box advances to the Filter Settings page.
-
For each filter to be modified, do one or more of the following:
To delete a filtering profile or change its order:
- Right-click the profile and choose Remove, Move Up, or Move Down.
To modify a filtering profile:
- Click on the filtering profile and select a new profile, or right-click the profile and choose Customize. (See Filtering Profile for more information.)
To add a filtering profile:
- Click
<Add>… and select a filtering profile to use.
-
When you have modified all desired filtering, click Next.
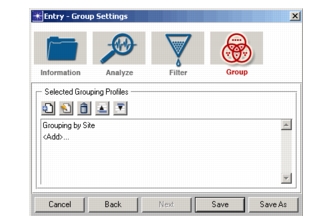
The Entry dialog box advances to the Group Settings page.
-
For each grouping to be modified, do one or more of the following:
To delete a grouping profile or change its order:
- Right-click the profile and choose Remove, Move Up, or Move Down.
To modify a grouping profile:
- Click on the grouping profile and select a new profile, or right-click the profile and choose Customize. (See Grouping Profile for more information.)
To add a grouping profile:
- Click
<Add>… and select a grouping profile to use.
-
When you have modified all desired groupings, do one of the following:
- Click Save to replace the existing entry with the new settings.
- Click Save As to save the modified entry under a new name.
Display Profile
A display profile specifies whether the analysis outputs of an entry should be displayed in a chart or table and defines the characteristics of the display.
Figure 134: Sample Display Profile
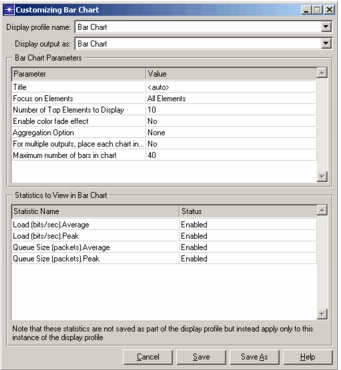
The lower half of the display profile lists the statistics and analysis outputs that will be displayed by the entry. Those statistics with Status set to Enabled will be included in reports using the specified display type and parameters.
To customize a display profile, right-click on the profile name in a Customizing <page> dialog box and choose Customize.
Analysis Profile
An analysis profile specifies what analysis outputs you want to have for a given metric type. Only the outputs specified by the selected profile will be available for display in a report.
For example, the analysis profile in Figure 135 produces outputs for the average and peak values of a metric, as well as values for a time plot. You could include several instances of an entry using this profile in a report, with a different display profile for each instance. Each instance of the entry would result in charts or tables for both the average and peak values. You would be able to right-click on any value and get a time plot for that value.
Figure 135: Sample Analysis Profile
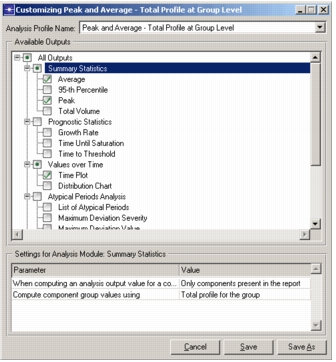
When you create or modify an entry, you can click in the Analysis Profile cell (on the Analyzer Settings page of the Entry dialog box) to select from the available profiles. To customize an analysis profile, right-click on the profile name in the cell and choose Customize.
Filtering Profile
A filtering profile specifies which components will be considered for analysis based on characteristics such as data thresholds or machine types. For example, you could filter by node roles to focus your analysis on components you have identified in your network as database servers.
Figure 136: Sample Filtering Profile
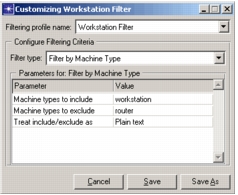
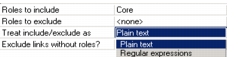
Use plain text or a Python regular expression to specify criteria by setting the “Treat include/exclude as” parameter, as shown in the following figure.
Figure 137: Filtering by Regular Expression
To customize a filtering profile, right-click on the profile name (on the Filter Settings page of the Entry dialog box) and choose Customize.
Grouping Profile
A grouping profile specifies how to group components to be analyzed and reported as aggregates, based on characteristics such as site or name. This would allow, for example, a report of TopN sites by total throughput of all links outgoing from each site.
Figure 138: Sample Grouping Profile
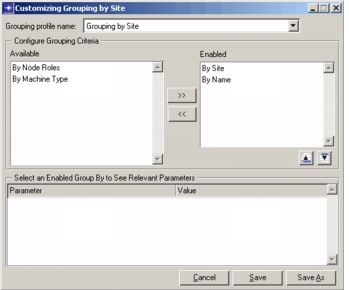
To customize a grouping profile, right-click on the profile name (on the Group Settings page of the Entry dialog box) and choose Customize.