Edit Panel Properties
This operation allows you to edit the properties that affect how an analysis panel is displayed. You can change these properties in the panel's Edit Panel dialog box, which opens when you choose Edit Panel Properties from the Panel pop-up menu. These properties do not change the data, only the manner in which the data is displayed.
Figure 147: Edit Panel Dialog Box
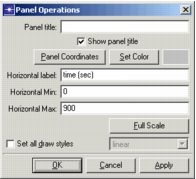
The Edit Panel dialog box contains options that affect the way information is displayed in the entire panel. The following table lists the panel operations.
Table 69: Panel Properties and Operations
| Name | Description |
|---|---|
| Apply | Applies current property settings to the analysis panel without closing the Edit Panel dialog box. |
| Cancel | Closes the Edit Panel dialog box without making further changes to the analysis panel. Changes made previously with the Apply button are not affected. |
| Draw style pull-down | Specifies the drawing style for all statistics in all graphs. |
| Full Scale | Restores Horizontal values to their original defaults. |
| Horizontal Label | Specifies the text of the horizontal label. The default label is the time scale (for vectors) or the output scalar name. |
| Horizontal Min | Specifies the minimum value of the horizontal. |
| Horizontal Max | Specifies the maximum value of the horizontal. |
| OK | Applies current property settings to the analysis panel and closes the Edit Panel dialog box. |
| Panel Coordinates | Summons the Set Panel Coordinates dialog box. Use this dialog box to specify the location and size of the panel. |
| Panel title | Specifies the text of the panel title. |
| Show panel title | When selected, enables display of the panel title. By default, this option is selected. |
| Set all draw styles | When selected, causes a change in draw style to apply to all statistics in the panel. The default setting is deselected. |
| Set Color | Allows you to specify the color of the outer frame of the analysis panel (the area around the graphs), by clicking the Set… button. |