Open DES Log
This operation displays a log containing errors, significant simulation events, and a summary of simulation performance. The DES log is written to a tab-delimited ASCII file. Simulation logs can be viewed in the log viewer (see "Log Viewer") or directly from a DES menu (Procedure 131).
By default, simulation times are displayed in the log with twelve decimal places. You can change this with the "log_time_precision" preference.
Procedure 131: Viewing the Simulation Log
-
Right-click in the Project Editor workspace or on a node or link, then choose Open DES Log from the pop-up menu. (Alternatively, choose DES > Open DES Log.)
The log viewer opens with the Discrete Event Simulation tab selected and logs for the current scenario listed in the log treeview. The columns displayed in the DES log are listed in Table 58.
Figure 111: Log Browser
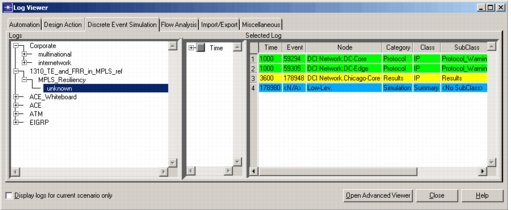
Table 58: DES Log Fields
| Label | Description |
|---|---|
| Time | Simulation time of the log entry |
| Event | Current simulation event number |
| Node | Node at which log event occurred (if any) |
| Category | “Low-Level” errors are simulation errors such as recoverable or diagnostic errors. “Results” messages describe events or conditions of the simulation that may affect the expected results. For example, if RIP routing is disabled, a results log entry is made because no routing packets are being sent, and less load is being imposed on the network. “Configuration” messages cover configuration of the topology or connectivity of network devices. “Protocol” messages are those generated at the protocol level (TCP, IP, ATM) |
| Class | Protocol layer generating the message |
| Subclass | Subset of protocol generating the message (routing, transmission, results) |
| Message | Full text of the log message. May contain possible causes of errors and suggestions to prevent similar errors. |