Find Top Statistics
This operation allows you to quickly determine which nodes and links produced the maximum or minimum values for any given statistic in the last simulation.
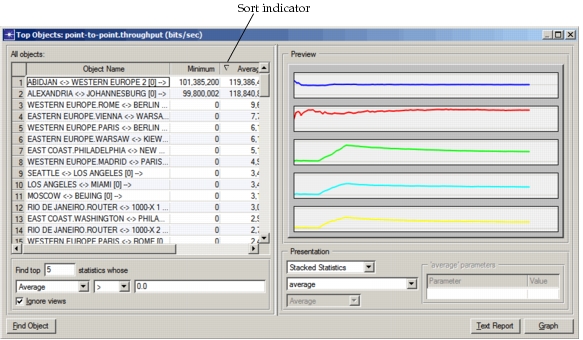
Choosing Find Top Statistics from the DES menu (or Find Top Results from the Workspace pop-up menu) opens a statistic browser containing link, path, demand, and node statistics from the current scenario. Selecting a statistic in this browser will open a dialog box showing the objects that produced the top 10 average values for that statistic during the last simulation run.
The Top Objects dialog box allows you to
- sort results by minimum, average, maximum or standard deviation, in ascending or descending order
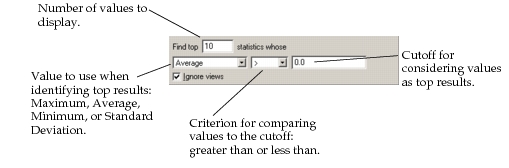
- change the criteria for determining top results
- create a graph, filtered graph, or text report containing all statistic values for the top objects
- create a bar chart comparing minimum, average, maximum, or standard deviation of statistic values for the top objects
- move to the subnet view containing a selected object
You may have applied a service level agreement (SLA) to the scenario. If the graph displays a statistic covered by the SLA, violations of the SLA will be shown in analysis panels. See Viewing SLA Violations for a detailed explanation of the graphs produced by an SLA. These same graphs also appear in web reports.
Figure 112: Top Objects Dialog Box
Procedure 134: Finding Top Results
-
Choose DES > Results > Find Top Statistics… (or Find Top Results from the Workspace pop-up menu).
The Select Statistic for Top Results browser appears.
-
Find and select the statistic you wish to display.
The Find Top Results button becomes active.
-
Click the Find Top Results button.
The Top Objects dialog box opens for the statistic you selected. The statistic browser remains open until you click the Close button.
-
If desired, use the controls in the lower left part of the dialog box to change the top results criteria, as shown in the following figure.
Procedure 135: Changing the Sort Order
-
Click on the column header for the value that you want to use to sort the entries (Minimum, Average, Maximum, or Standard Deviation).
The sort indicator moves into the specified column and the entries are sorted by the chosen values.
-
To change the direction of the sort (largest to smallest or smallest to largest), click on the header again.
The sort indicator changes to indicate ascending or descending order, and the objects are sorted in the chosen order.
Procedure 136: Creating a Graph
-
Specify whether you want stacked statistics, overlaid statistics, or a bar chart.
-
For stacked or overlaid statistics, specify whether the values should be graphed “As Is” or filtered in some way. For a bar chart, specify which computed value to graph.
-
Click the Graph button.
An analysis panel is drawn showing the requested graph.
Procedure 137: Creating an ASCII Report
-
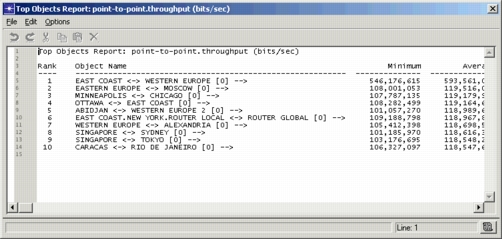
Click the Text Report button.
An edit pad opens containing a text version of the information shown in the Top Objects dialog box.
Procedure 138: Finding a Node
-
Select an object in the Object Name column of the Top Objects dialog box.
-
Click the Find Object button.
The workspace view changes to show the subnet containing the selected object.