Log Viewer
Riverbed Modeler generates a variety of logs that record errors and other significant events. These logs include the system and error logs, discrete event simulation (DES) logs, and import logs. The log viewer provides a convenient way to view all of these logs in one place.
Figure 9: Log Viewer (Event-Based Log)
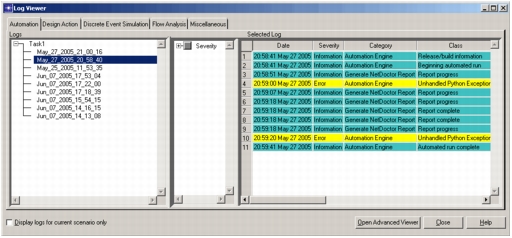
The log viewer has a tab for each type of log that is available for viewing (Automation, Discrete Event Simulation, and so on). A Miscellaneous tab provides access to logs that don’t fit under the other tabs (such as the session and error logs). The Logs pane (on the left) contains a treeview of all available logs of the selected type. The “Display logs for current scenario only” checkbox lets you specify whether the treeview should list all logs or only those for the current scenario.
You can open the log viewer in three ways:
- From the System window: Choose Help > Show All Logs. (All available logs are listed.)
- From a Project Editor: Choose Help > Show All Logs. (Only logs for the current scenario are listed.)
- From a specific menu: Choose the “show logs” operation from a menu such as Flow Analysis or DES (for example, DES > Open DES Log). (The corresponding tab is preselected and only logs for the current scenario are listed.)
Log Types
The log viewer can display both kinds of logs created by Riverbed Modeler: text-based and event-based.
Text-Based Logs
Text-based logs contain a simple text description of events (for example, the session and error logs). These logs open in a single pane in the Selected Log part of the viewer.
Event-Based Logs
Event-based logs organize event information as records. When opened, these logs add two panes to the Selected Log part of the viewer (as shown in Figure 9). The right-hand pane contains the log data, one event per row. Each row has several columns with information about the event (the number of columns depends on the type of log). You can resize the columns as needed. Message columns often contain lengthy information: you can click on a Message cell to open a text pad with the complete text of the message.
Right-click in the data pane to open a pop-up menu that lets you copy information from the log or hide specific columns.
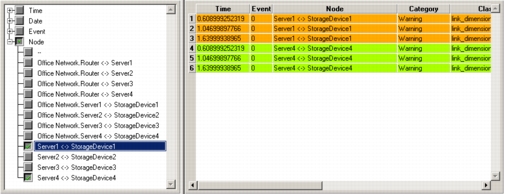
The left-hand pane of an event-based log (in the center of the log viewer) contains a filter treeview that lets you restrict the log display to only those events with specific column values. Each column node in the filter treeview can be expanded to show all of the values that appear in that column of the log. You can select one or more values to restrict the log display to only those events that have the selected values.
Figure 10: Filter Example
Advanced Log Viewer
You can open the currently displayed log in an advanced log viewer by clicking the Open Advanced Viewer button. The advanced viewer displays the log (either a text pane or the filter treeview and data panes, depending on log type), plus gives additional capabilities through a menu bar.
Figure 11: Advanced Log Viewer (Event-Based Logs)
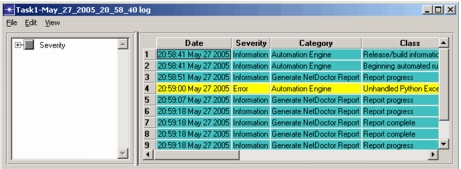
With event-based logs, for example, the menus let you:
- Change which column is used to color-code the log entries and what color is used for each unique value in that column.
- Change which columns are visible or filterable.
- Save the current viewer settings.
- Export the log to a text, comma-separated ASCII, HTML, or XML file.
The advanced viewer’s pop-up menu (accessed by right-clicking in the data pane) adds the ability to sort and filter the event rows.
With text-based logs, the advanced viewer provides all the capabilities of a text-edit pad, including text searches and saving the log to a different file.