Visualizing Protocols Configured in a Network
After the network topology is created, most of the remaining configuration is done in attributes. The values of these attributes are not readily viewed in the project editor workspace; however there are several visualization operations for viewing common protocol configuration settings. These operations, which appear on the View > Visualize Protocol Configuration submenu, are listed in the following table.
Table 40: Protocol Visualization Operations
| Operation | Description |
|---|---|
| Layer 3/Layer 2 Interface Status | Shows whether the connected interface is Up, Administratively Down, or Operationally Down. If the administrative or operational status of an interface cannot be determined, then the link is not colored. |
| IP Routing Protocols | Shows the routing protocols that are configured on the router interfaces. Select one of the following from the submenu: • IPv4 Routing Protocols • IPV6 Routing Protocols |
| IP Address Types | Shows the IP address types on the network by color, along with a legend to explain the color-coding. |
| IP QoS Configuration | Shows the IP QoS configuration on the links. |
| IP Security Configuration | Shows the packet filtering security configured on the links. |
| IP Tunnel Configuration | Adds colored path objects to the workspace to represent the IP tunnels configured in the network. |
| BGP Peers | Shows the BGP peering (neighbor) relationships in the network. |
| OSPF Area Configuration… | Shows the OSPF areas configured on the router interfaces. |
| IPv4 Interface Metrics | Shows the IGP routing metrics on the link for one of the following choices: • IGP Metrics (lowest Admin Distance) • OSPF Metrics • ISIS Metrics • IGRP Metrics • EIGRP Metrics • MPLS TE Metrics |
| IPv4 Process Tags | Shows protocol process identifiers (IDs) on the link for a given interior gateway protocol (IGP). The following selections are available from the menu: • IGP Process Tags (lowest Admin Distance) • IGRP AS(es) • EIGRP AS(es) • OSPF Process Tags • IS-IS Process Tags |
| ATM Routing Domains | Shows which ATM routing protocols that are configured on the switch ports. |
| VLAN Configuration… | Shows the VLANs configured in the network. |
| HAIPE Versions | Shows the HAIPE versions configured in the network. |
| Clear Visualization | Removes all protocol configuration visualizations from the workspace. |
Only one protocol visualization can be shown at a time. After viewing protocol configurations, you can remove them from the workspace using the View > Clear Visualization operation. Visualizations are not saved with the project, so all visualizations are lost when the project is closed.
Some visualizations are described further in the following sections:
IP Routing Domains
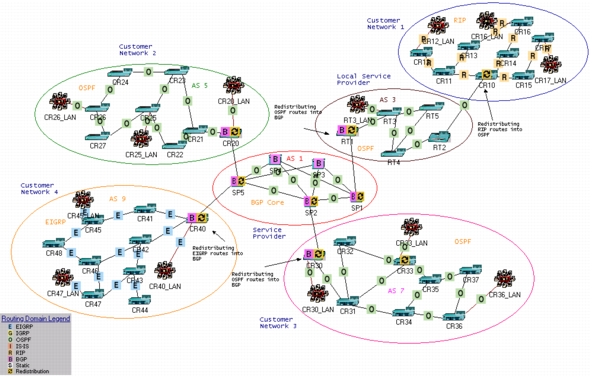
The Visualize IP Routing Domains operation shows the routing protocols configured in the network. Icons are placed on the links in the network to indicate the routing protocol(s) that are configured on the interfaces attached to the link. When routing domains are shown in the workspace, a legend appears in the lower left-hand corner to indicate what each icon represents.
Figure 56: Visualizing Routing Domains
BGP Peers
The Visualize BGP Peers operation shows the BGP peering (neighbor) relationships in the network. EBGP confederation peers are shown in dark green, EBGP peers are shown in blue, all other colors indicate IBGP peers. Additional information about the peers appears in the tooltip of the peering visualization. For networks using route reflection, the visualization also indicates if a router is a reflector or a client.
OSPF Area Configuration
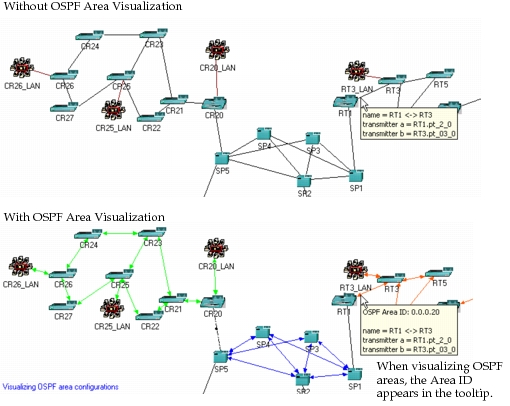
The Visualize OSPF Area Configuration operation colors the links in the workspace so that each area in the network is represented by a different color. When you launch this operation from the menu, a dialog box appears to let you specify the color to use for each area ID configured in the network.
You can identify the area ID of a link by viewing its tooltip, which is visible when you position the pointer over the link.
Figure 57: Visualizing OSPF Areas
IPv4 Process Tags
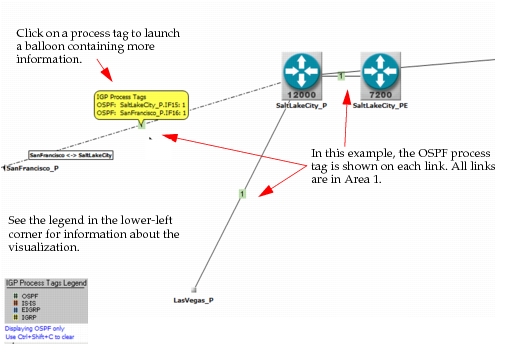
It can be useful to see an overview of the protocol processes configured in a network model. With IPv4 process tag visualization, you can view the IPv4 processes in the project editor. In the example below, we see OSPF process visualization. Each link is labeled with the OSPF area it belongs to, and more information is available in the balloon when you click on the tag. Rather than having to directly view the attributes on each device, you can get a birds-eye view of the protocol process configuration in your network using this option.
Figure 58: Visualizing IPv4 Process Tags
Note: When you select IGP Process Tags (lowest Admin Distance), the configured IGP for each interface is displayed. If more than one IGP is configured on the interface, the IGP with the lowest administrative distance (defined in the IP Routing Parameters.Administrative Weights table on each router) is displayed.