Visualizing Link Usage
Use the Visualize Link Usage feature to see overall link-load levels (utilization or throughput) quickly and to pinpoint overloaded links. When link usage visualization is enabled, colored arrows appear over the links. The line color indicates the usage level (as a percentage of total capacity) in each direction; the line thickness indicates the total link capacity. Optionally, the utilization percentage or throughput values for each link can be displayed.
Riverbed Modeler provides a common interface for visualizing link usage, regardless of the data source (such as attributes on link objects or outputs from discrete event simulations and Flow Analysis):
-
To turn on link-load visualization, choose View > Visualize Link Usage > Color by Link Usage… This menu item opens a dialog box that prompts for the link-load data source and the type of data to visualize.
-
To clear link-load visualization, choose View > Visualize Link Usage > Clear Visualization.
-
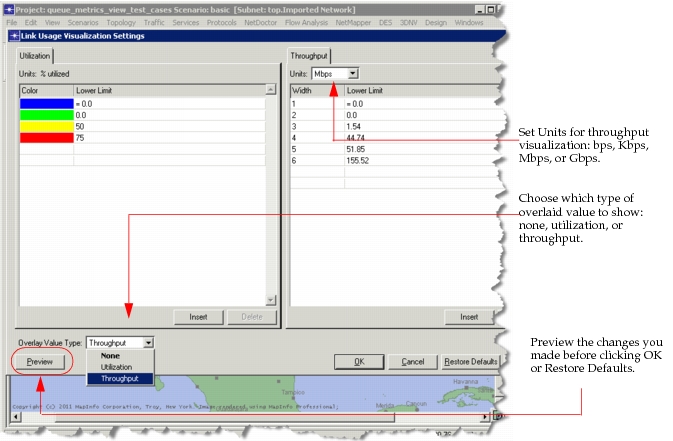
To change the visualization settings (thresholds, colors, line widths, and display of link utilization or throughput values), choose View > Visualize Link Usage > Settings..., shown below.
Figure 55: Configure Link Visualization Settings
Use the following preferences to define the display of link utilization values:
- "domain_fonts.link_special_title" – Specifies the font used to display link utilization values.
- "link_util_vis.display_value" – Specifies whether to display link utilization values in the network topology of the Project Editor.
- "link_util_vis.display_value_style" – Specifies the style for the display of link utilization values. Choose from white background highlight, white background with box, dynamic color with box, dynamic color highlight, plain black text.
-
To see how link-load levels change over time, turn on link-load visualization, then choose View > Show Time Controller. For more information, see Show Time Controller.