Color by Link Load
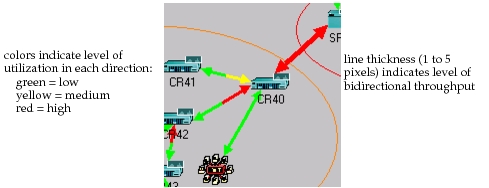
After a discrete event simulation, you can view link utilizations and throughputs throughout the network. The Color by Link Load operation draws an arrow over each link to indicate the utilization (arrow color) and throughput (arrow thickness) on that link, as shown in the following figure.
Figure 36: Visualizing Link Utilization and Throughput
Procedure 54: Viewing Link Visualizations
-
Configure and run a discrete event simulation to collect results for the link utilizations and throughputs in your network.
Note: The data collected during the most recent simulation is used to visualize the utilization and throughput on each link. Therefore, make sure that the relevant link statistics are selected in the Choose Results dialog box (DES > Choose Individual Statistics…) before running the simulation.
-
If you have any other type of visualization enabled on the links, disable this visualization.
-
When the simulation completes, choose DES > Color Links by Utilization.
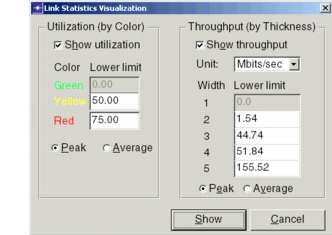
Result: The Link Statistics Visualization dialog box appears.
Figure 37: Link Statistics Visualization Dialog Box
-
Optionally, change the default settings. By default, the peak values for both utilization and throughput are visualized.
-
Click Show to view the link visualizations.