Viewing and Managing Traffic Flows and Baseline Link Loads
After importing baseline link loads and traffic flows, you can use the Traffic Center to view and manage the background traffic in your network model.
The next sections provide an overview of using the Traffic Center from the Traffic menu and the View Link Usage utility from the right-click menu on links. You can also use the View menu as described in the last section. For more information, see:
- Using the Traffic Center for Imported Network Traffic
- Using View Link Usage (from Right-Click Menu)
- Using the View Menu to Visualize Traffic Information
Using the Traffic Center for Imported Network Traffic
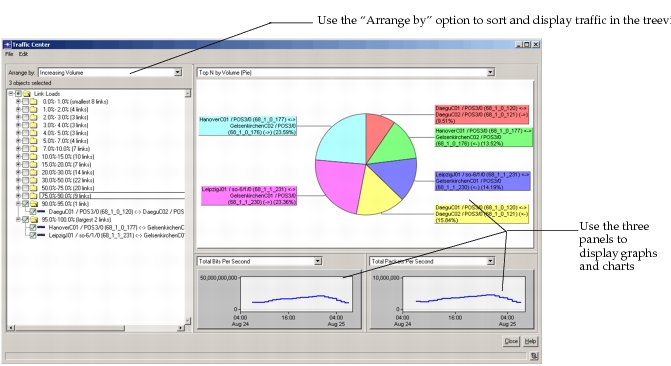
The Traffic Center helps you view and manage the background traffic in the network. For example, you can view and select traffic based on volume and other characteristics using the “Arrange by” option in the left pane, and then use the three panels on the right to show summary charts and graphs about the traffic selected.
The following figure shows an example of the “Top N” traffic elements in a pie chart.
Figure 29: Viewing Traffic by Volume in the Traffic Center
In most cases, you need to refine the baseline traffic matrix in your network before doing analysis. Use “Step 3: Manage Traffic Data in the Traffic Center“ in the “Importing Network Traffic“ Workflow as a guide for your strategies.
For more general information, see “Using the Traffic Center“ in the User Guide.
Using View Link Usage (from Right-Click Menu)
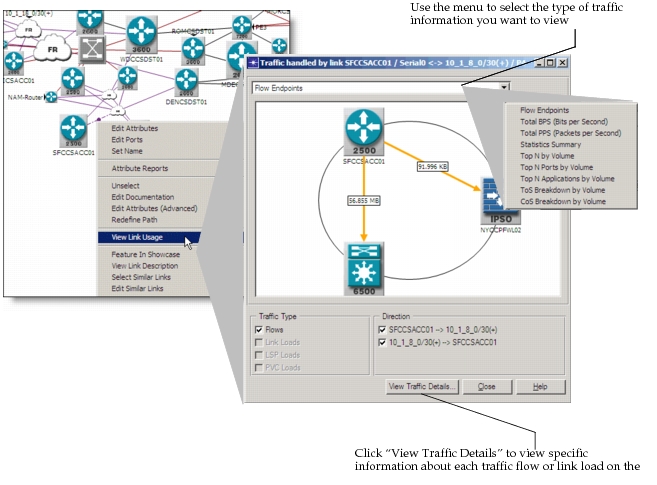
After importing network traffic and running flow analysis, you can right-click and choose “View Link Usage” to view specific traffic data by Flows, Link Loads, LSP Loads, PVC Loads as shown in the following figure.
Figure 30: View Link Usage
Using the View Menu to Visualize Traffic Information
The View menu also includes options to visualize traffic flow and link load information. You can use the View menu to:
- Visualize traffic flows by choosing View > Demands > Show All / Hide All.
- Visualize link utilization by choosing View > View Link Usage > Color By Link Usage
- Visualize IPv4 interface metrics by choosing View > Visualize Protocol Configuration > IPv4 Interface Metrics
- Visualize datarates and link technologies by choosing View > Visualize Network Configuration > Link Datarate / Technology
For more specific step-by-step instructions for analyzing traffic after import, see the following workflows:
- “Conducting Network Capacity Planning Studies”
- “Evaluating Existing and Proposed VoIP Deployments”