Verifying a Baseline Load Import
It is good practice after each import to verify that the data was imported correctly. You can do the following steps to verify an import:
- Visualizing Link Loads – Use this operation to view the most recent levels of utilization on all links in the network. This operation is useful for determining if the overall link utilizations correspond to the imported data.
- Visualizing IGP Metrics – You can view the IGP metrics in the project editor before and after doing traffic engineering studies.
- View the Import Log – The Import Log contains diagnostic information about the most recent import. This log describes any parsing or other errors that might have occurred. To open the import log, choose Traffic > Import Baseline Baseline Loads > Open Import Log.
Note: When traffic load data does not contain an end time value, the last data point in the traffic profile is calculated based on the information available from the time values in the files.
Visualizing Link Loads
To view the level of link loads in your network, choose View > Visualize Link Loads > Color by Link Load. When this option is enabled, NetPlanner shows a colored arrow over each link that has a background load specified. Colors on each arrow indicate the most recent throughput; the link has directional throughput specified, two arrows show throughput level in each direction.
Figure 25: Visualizing Link Loads
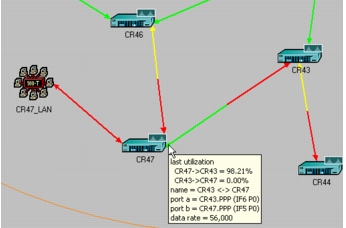
To disable link-load visualization, choose View > Visualize Link Loads > Clear Visualization.
Visualizing IGP Metrics
The IGP metric visualization feature provides a quick way of identifying IPv4 interface metrics by protocol. Choose View > Visualize Protocol Configuration > IPv4 Interface Metrics, as shown in Figure 2-22.
Figure 26: IPv4 Interface Metric Menu
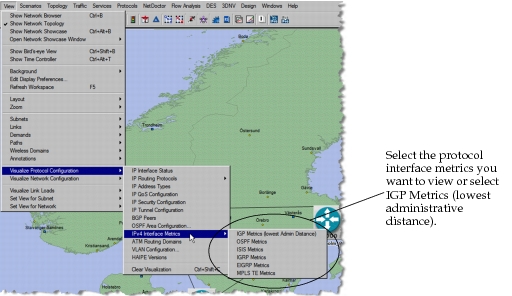
Note: When you select IGP Metrics (lowest administrative distance), the configured IGP for each interface is displayed. If more than one IGP is configured on the interface, the IGP with the lowest administrative distance (defined in the IP Routing Parameters.Administrative Weights table on each router) is displayed.
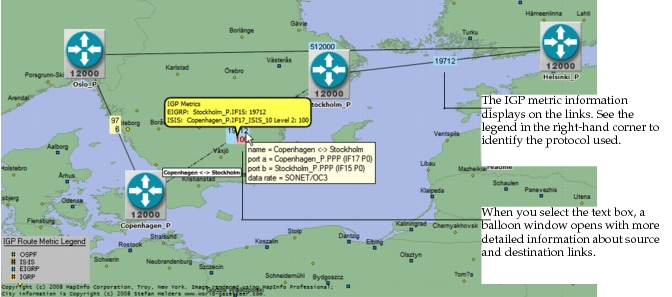
After selecting the protocol, the IGP metric information displays as shown in Figure 2-23.
Figure 27: IGP Metric Visualization
For more information, see: