Template Statistics
Users of the Results Browser frequently find that they must execute the same operations to view data from different simulation runs. In other words, after each simulation, or set of simulations, the same statistics are loaded into the Results Browser, with only the content of those statistics changing. This leads to the notion that the specification for the manipulations and presentation of data can be saved independently from the data itself. The specifications can then be simply "applied" to data resulting from new simulations, to automatically obtain processed and displayed information. The Results Browser supports this capability with a feature called template statistics.
Each graph in an analysis panel can be given a special status called "template". A template graph contains no data (it is stripped of its data at the time that it becomes a template). However, it does contain all of the configuration information, such as the name of the original vectors or scalars that were used to create it, and the operations that might have been applied to that data. It also contains display information such as draw style and color. In other words, only the graph's entries (abscissa-ordinate pairs) are missing. The Results Browser provides several operations that support converting graphs from ordinary form to template form. See "Project Editor" on page 89 for more information.
The utility of a template graph is that it can again become an ordinary graph by using its configuration information to display new data that is "applied" to it. The new graph data need only match the graphs requirements—namely that the names of the original scalar or vector statistics be the same. Using this feature, the output statistics from many different simulations can be automatically processed and displayed in an identical manner without having to go through the individual steps required to generate each graph. The Results Browser supports applying data to template panels when the data is loaded from output files. In other words, when an output vector file is opened, the Results Browser provides the option to match the data against the template graphs' specifications and "fill in" the data if possible.
Figure 269: Successive Applications of OV Data to a Template Panel
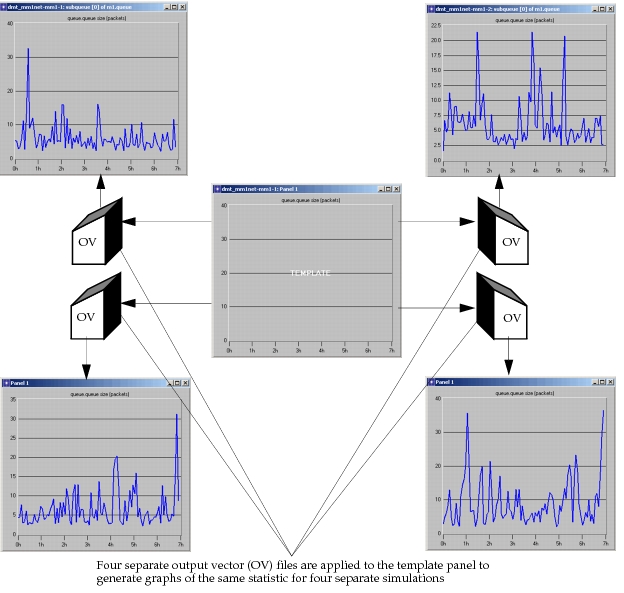
The Results Browser provides the flexibility of changing individual graphs to templates, allowing panels to simultaneously contain template and ordinary graphs. However, in typical cases, all of the graphs in a panel are converted to template form at the same time (the Results Browser provides a "global" operation to do this). A panel containing only template graphs is referred to as a template panel. The following figure shows examples of these cases.
Figure 270: Application of OV Data to a Mixed Template Panel
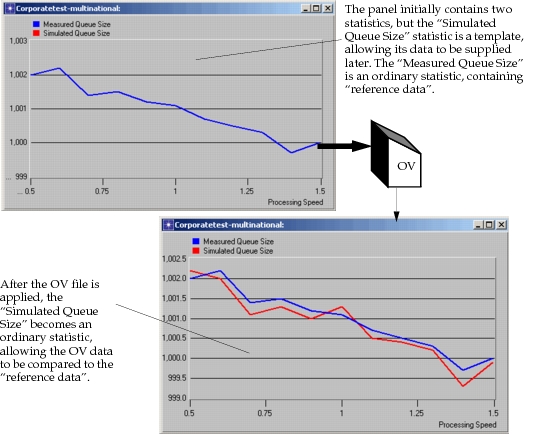
Note: Output files can be applied to graphs at any time and only modify those graphs that are selected and that match the data. This allows successive applications to be performed to the same template panel to progressively fill in additional data.