Data Sources
Analysis panels can be created by a number of different operations in the Results Browser. Because all panels must contain at least one statistic, these operations require a source of data on which to base the new panel. There are two possible sources of data (only one might be applicable, depending on the operation).
Output Vector Files
Output vector files are usually generated by simulations to store dynamic statistics (i.e., statistics that vary as a function of simulation time). However, they can also be generated via the External Model Access (Ema) interface, which is Modeler's general API (application program interface) for proprietary file formats. In both cases, output vector files consist of a set of vectors and a directory that describes the vectors' locations within the file, to support fast access. Each vector has essentially the same content as a statistic, including a series of abscissa-ordinate entries. The abscissa variable generally represents simulation time in an output vector generated by a simulation; however, if Ema is used to build the file, the abscissa can represent any user-defined variable.
Vectors can be loaded into the Results Browser to serve as the basis of most of the available operations. The simplest vector-loading operation allows one statistic to be viewed in a panel. Numerous filters can also be applied to the data. For more information, see "View Results" on page 309.
Some cosimulation objects produce enumerated output vector files. These vector files do not contain a scalar vertical axis, but rather a vertical axis with an enumerated set of values. A specified dictionary file defines the possible ordinate values. Statistics produced from enumerated vector output files will not work with some of the filters and functions available in the Results Browser (a Probability Density panel, for example).
Output vector files also store scalar statistics, which are stored as individual real numbers. Typically, each scalar statistic accumulates one value per simulation, although it is possible to accumulate multiple values in one simulation. A scalar statistic can be thought of as a "summary" of some aspect of the system's behavior or performance, as evidenced during one particular simulation run. Scalar statistics can also represent system input or operating conditions, obtained either from model attributes or from measurements made during the simulation. See Chapter 10 "Simulation Design" on page 375 for more information about generating output scalars.
Because scalar statistics do not depend on time, but on other quantities in the system, they cannot be plotted without choosing another variable with which a dependency can be expressed. The Results Browser therefore supports plotting of scalar statistics "against" one another, using the DES Parametric Studies page. Plotting scalar Y against scalar X shows the possible values of scalar Y for individual values of scalar X. If there are several values of Y for a given value of X (e.g., in different simulations using distinct random number seeds), then several vertically "stacked" data points appear in the graph.
The following figure of a scalar panel in the Results Browser shows this stacking effect.
Figure 266: Two Output Scalars Plotted Against Each Other
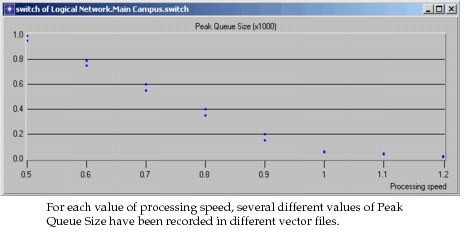
Note that the relationship that is shown in a scalar plot is not necessarily due to an inherent dependency between the output scalars. The plot merely shows how the two quantities varied simultaneously over a series of experiments. The causal nature of the relationship between the two variables must be inferred by the user based on additional knowledge about the actual meaning of these variables. Modeler is not able to make such inferences in an automated fashion.
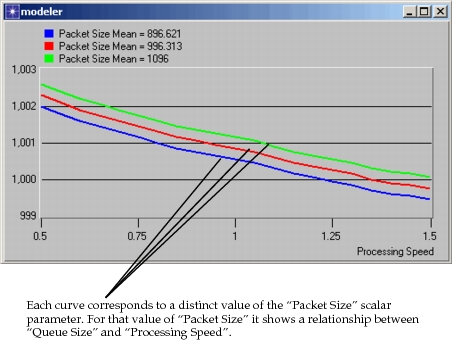
The Results Browser supports a second approach to visualizing scalar data that is useful when the relationship between three scalar variables is of interest. The supporting panel is called a parametric scalar panel and is created on the DES Parametric Studies tabbed page. In a parametric scalar panel, an abscissa variable and an ordinate variable play the same role as in an ordinary scalar panel. However, a third variable called "parameter", is used to separate the sets of resulting points into distinct subsets. In each subset, the parameter has a fixed value which is distinct from the parameter's value in each of the other subsets. The result is a "family" of curves plotted in the panel, as shown in the following example.
Figure 267: Three Output Scalars in Parametric Scalar Form
ASCII Representations of Statistic Data
Graphical plotting is the main form of information display used in the Results Browser to visualize relationships between variables. However, in some cases, visual representation may be ambiguous due to limited screen space and resolution. For example, two values that are distinct but extremely close to each other may be interpreted as being equal, or the points that represent them may occlude each other. In addition, it is sometimes necessary to have knowledge of exact, or near-exact values shown in the statistics. The Results Browser provides two operations to allow users to obtain more detailed knowledge of statistic contents:
- The Statistic Data option
- The General Statistic Information option
For instructions on both options, see "Project Editor" on page 89.
Statistic Data Option
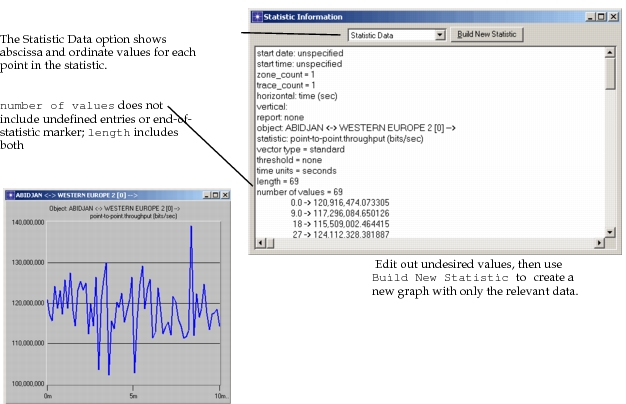
The most detailed view of a statistic's data can be obtained by using the Statistic Data option, which is provided by the Statistic Information operation. This option displays the explicit contents of the statistics that the panel includes. The statistics' lengths and axes labels are given as well as each entry's abscissa and ordinate value. This operation applies to the visible portion of the panel, meaning that if a panel's axes bounds have been modified, or if the zoom operation has been used, less than the statistic's full content may be displayed. The following panel and editing pad illustrate the capability provided by the Statistic Data option.
Figure 268: Analysis Panel and Equivalent Textual Representation
General Statistic Information Option
To allow users to quickly obtain high-level information about the statistic(s) in an existing panel, the Results Browser provides the General Statistic Info option of the Statistic Info… operation. The information is provided on a per-statistic basis and applies to the portion of a statistic that falls within the abscissa range of the panel (though entries immediately preceding and immediately following the range may be included as well). Therefore, if a panel's full vertical span has been reduced by editing the vertical or horizontal scales, or by zooming, less than the full content of the statistic will be taken into account. The following table explains the information provided by this option:
Table 135: General Statistic Information
- length — Number of entries in statistic (including special entry for end-of-statistic).
- number of values — number of entries in statistic, not including undefined values or end-of-statistic marker.
- horizontal min, max — Minimum and maximum abscissa values.
- vertical min, max — Minimum and maximum ordinate values.
- initial value — Ordinate value of first entry.
- final value — Ordinate value of last entry.
- expected value — Average value of ordinate variable treated as a step function (i.e., using sample-and-hold interpretation of data) and weighting each entry by the abscissa interval until the next entry; corresponds to calculation performed by "time-average" filter.
- sample mean — Mean value of entries' ordinates computed by weighting all entries equally; corresponds to calculation performed by "average" filter.
- variance — Variance of ordinate values; this is the mean value of the squared deviation from the sample mean.
- standard deviation — Square root of the variance; represents typical distance between an ordinate value and the mean ordinate value.
- confidence intervals — Intervals estimated to contain the true mean of entries' ordinate values with five separate levels of confidence; calculations are based on principles described in Computing Confidence in Simulation Results; these results are meaningful only if entries are independent measurements.