Results Browser
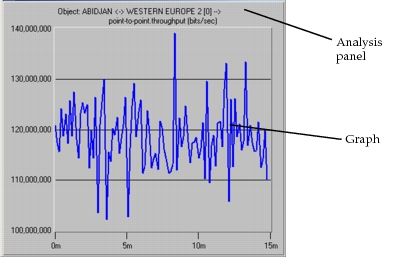
The Results Browser is used to display information in the form of graphs. Graphs are presented within rectangular areas called analysis panels. Each analysis panel can have one or more graphs. A graph is the part of the analysis panel that can contain statistics. A number of different operations can be used to create graphs and analysis panels, all of which have as their basic purpose to display a new set of data or to transform an existing one. An analysis panel consists of a plotting area, with two numbered axes generally referred to as the horizontal axis (abscissa), and the vertical axis (ordinate). The plotting area can contain one or more graphs describing relationships between variables mapped to the two axes. For example, the graph in the following figure shows how the size of a queue varies as a function of time.
Figure 259: Analysis Panel Components