User-Defined Reports
A user-defined report is a set of output tables that list objects and attribute values of interest. User-defined reports are useful when you want to view and compare the attributes of multiple objects in custom tables. There are two kinds of user-defined reports:
- Static reports contain a snapshot of attribute values at the time of the report. Several tables can be specified and generated at one time. Static reports can be viewed on-screen or included in a web report.
- Live reports contain continuously updated attribute values and dynamically selected objects.
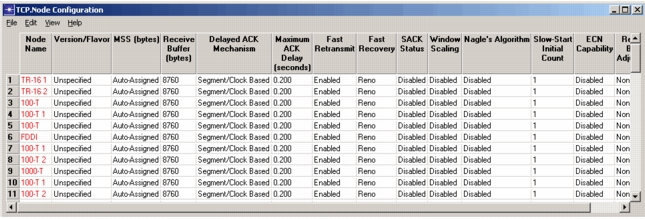
The two kinds of user-defined report tables have a similar appearance (see Figure 534). In both, you can click on an object name (shown in red) to zoom the network workspace to the corresponding object. The main difference is that the contents of a live report will change dynamically as you select different objects in the network or edit attribute values.
Figure 534: User-Defined Report
You control what kinds of information a report includes by specifying an attribute template. You can use predefined attribute templates from the Model Library or from some other source. You also can define custom attribute templates that include the specific objects and attributes you are interested in (see “Defining an Attribute Template” on page 391).
Generating a User-Defined Report
Follow Procedure 60 to generate a static report or Procedure 61 to open a live report.
Procedure 60: Generating a User-Defined Report
-
If you want to include a custom table in your report, choose Edit > Edit Attribute Template and define the table as described in “Defining an Attribute Template” on page 391.
-
Choose Scenarios > User-Defined Reports > Generate Report from Template…
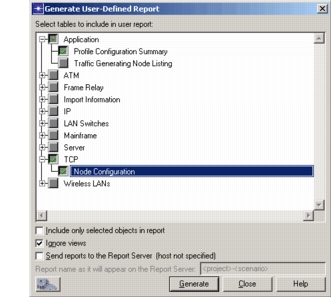
Result: The Generate User-Defined Report dialog box appears.
-
In the treeview, select the tables that you want to include in the report.
-
Set the following options, as needed:
-
Include only selected objects in report – When this checkbox is selected, only selected objects are included in the report.
-
Ignore views – When this checkbox is selected, the report considers all objects in the scenario, regardless of whether they are included in the current view.
-
Send reports to the Report Server (
<hostname>) – When this checkbox is selected, a copy of the generated report is sent to the Report Server specified by thereport_server_namepreference (Report Server module required). -
Report name as it will appear on the Report Server – Specifies the name of the report sent to Report Server (available only when the Report Server option is selected).
You can use two variables (
<project>and<scenario>) in this field. For example, you could enter “Mary’s<project>-<scenario>”. If you run a report from project “Corporate” and scenario “Internetwork”, the resulting report will be named “Mary’s Corporate-Internetwork”.
-
-
Click Generate.
Result: The View Results window opens. The treeview lists all tables included in the report.
- To open a table in a separate window, select the table name and click Show. The Preview pane will show a partial version of the selected table.
- To create a web report of all tables, click Generate Web Report.
Procedure 61: Opening a Live User-Defined Report Table
-
If you want to open a custom table, first choose Edit > Edit Attribute Template to define the table (as described in “Defining an Attribute Template” on page 391).
-
Choose Scenarios > User-Defined Reports > Open Live Report Table…
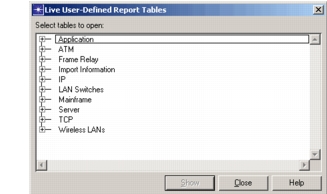
Result: The Live User-Defined Report Tables dialog box appears.
-
In the treeview, select the table you want to open and click Show.
Result: The live report table appears.
Note: If no objects matching the table definition were selected in the network, the table will be empty.
-
Select the network objects you want to view in the report. You can
- select objects one at a time to see the attributes of each sequentially
- select multiple objects and scroll through the table to compare attributes
Use any of the available selection methods (such as click-and-drag or the Select Similar Nodes operation) to select objects.