Analysis
The third phase of the simulation project involves examining the results collected during simulation. Typically, much of the data collected by simulation runs is placed in output vector files. Modeler provides a graphing and numerical processing environment in the Results Browser of the Project Editor.
Numerical Data Analysis
The Project Editor allows output vector files to be selected and individual or multiple vectors to be loaded and displayed as traces. Traces are ordered sets of abscissa and ordinate pairs, called entries (traces are similar in structure to vectors). In addition, scalars from the same file can be plotted against each other to view the results of multi-simulation parametric studies. After scalars are plotted this way, their data points have been grouped as ordered pairs and the resulting data set is treated as a trace. Two graphs, one generated from vector data and the other from scalar data, are shown in the following figure.
Figure 13: Scalar and Vector Data in Analysis Panels
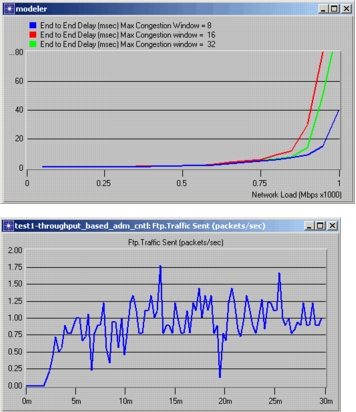
Traces are held and displayed in analysis panels. A number of display options are available to help you customize the data’s presentation. These include multi-level zoom, background colors, trace colors, plotting style, and labeling.
Key Concept—The Results Browser supports display of data stored in output vector files. Information is presented in the form of graphs, or traces. Each trace consists of a list of abscissa (“X”) and ordinate (“Y”) pairs. Traces are plotted in analysis panels.
Analysis panels provide a number of numerical processing operations that can be applied to traces or vectors to generate new data for plotting. These are listed in the following table.
Table 7: Trace/Vector Processing Operations
- Probability Mass Function (PMF)
- Cumulative Distribution Function (CDF)
- Histograms (occurrence and duration-based)
- Confidence Interval Calculation
- Mathematical Filters defined in Filter Editor
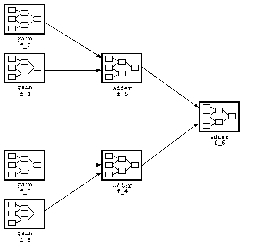
The Results Browser is linked to the Filter Editor, which supports the use of mathematical filters to process vector or trace data. Mathematical filters are defined as hierarchical block diagrams based on a predefined set of calculus, statistical, and arithmetic operators (a typical filter is shown in the diagram below). Predefined or user-defined filters can be invoked when specifying an analysis panel and applied to combinations of data from output vector files and existing analysis panels, to generate and display new traces.
Figure 14: Mathematical Filter Block Diagram
Key Concept—The Results Browser supports a variety of methods for processing output data and computing new traces. Calculations such as histograms, PDF, CDF, and confidence intervals are supported directly by the tool. You can also build mathematical filters in the Filter Editor. Resulting data is displayed in new analysis panels.