Metrics Options for Import from NetCollector
Using the Metrics Tab, you can import performance metrics, utilization data, or availability information for a variety of device types from NetCollector.
Note: CPU and RAM Utilization imports are also supported during incremental import from NetCollector.
Figure 11: Import from VNE Server—Metrics Tab
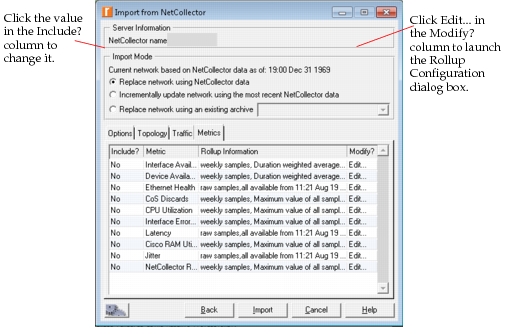
Note: Metrics data is imported in MTR files, with a separate file for each metric type.
The “Include?” column is set to No by default. Click on the value to change it. Configuration on the Metrics tab is similar to that on the Traffic tab, shown in Figure 9. See Rollup Configuration for Traffic and Metrics from NetCollector for more information about editing metrics rollup.
Rollup Configuration for Traffic and Metrics from NetCollector
You can roll up traffic or metrics data on the NetCollector with an extended selection of rollup criteria (e.g., 95th percentile), and then import that from NetPlanner. More flexible options for the time range are also available, as follows, when you click “Edit…” in the “Modify?” column of either the Traffic or the Metrics tab of the import from NetCollector dialog box.
Figure 12: Rollup Configuration for Traffic and Metrics from NetCollector
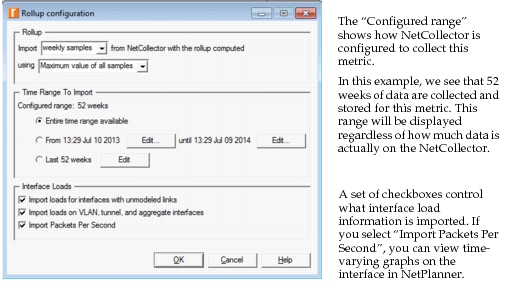
- Entire time range available – Imports samples from the time range displayed.
- From
<date/time>until<date/time>– Lets you edit the starting date/time and end date/time you want to import by selecting the respective Edit buttons. - Last
<weeks/days/hours/minutes>– Lets you edit the number of<weeks/days/hours/minutes>you want to import from the available time range.