Using Breakpoints in ODB
The control architecture of ODB is shown in Figure 9. When invoked, ODB acts as a valve that controls the execution of events in a simulation. The ODB "valve" can be open or closed. In the open state, ODB permits normal, sequential execution of events, leading to the delivery of interrupts to simulation objects. In the closed state, ODB halts event execution, waits for a user command, and processes the command when it is received. This closed state corresponds to the concept of a breakpoint in the simulation: the simulation is halted (a "break") at a specific "point" in the flow of events. The open state of the valve corresponds to the concept of simulation continuation. One of ODB's basic functions is halting the simulation at appropriate times, based on a list of pending breakpoints.
Figure 9: ODB/Simulation Control Architecture
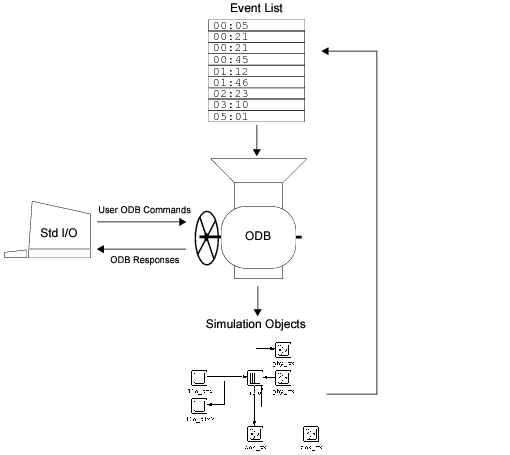
When the ODB interpreter is first entered, the simulation is breakpointed (i.e., event execution is halted and ODB awaits a command). At this point, the simulation time is 0.0, and the event list contains the initial set of begsim events for all modules which have this type of event enabled. The initial breakpoint allows an ODB command to be entered before the simulation starts executing events.
There are two methods of advancing simulation execution within ODB: single-event execution, and continuation of event execution until a breakpoint occurs. Single-event execution is accomplished with the command next, which executes the immediately pending event and automatically breakpoints before the next event. With this method, a user has fine-grain control of a simulation, and information about every event is printed before it is executed. However, simulations may need to execute hundreds of thousands of events before reaching the events in which a user is interested. User-defined breakpoints allow a simulation to progress at maximum execution speed until something of interest occurs. The ODB command cont (short for continue) commences simulation event execution until a pending breakpoint occurs.
Figure 10: ODB-Controlled Event Execution
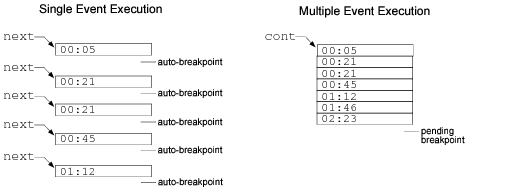
Besides occurring between two events, breakpoints can also occur during the execution of a single event. Such intra-event breakpoints are either triggered by the invocation of a specific process, or by a process invoking a breakpoint-inducing KP. When such breakpoints are encountered within an event, several next or cont commands may be required to move beyond that event, as illustrated below.
Figure 11: Intra-Event Breakpoints

When a breakpoint occurs between events, ODB prints a banner that describes the next pending event. Since the event is described prior to execution, a user can decide whether the event is of special interest and should be closely observed as it executes. The format of event banners is displayed below, and described in the following paragraphs.
Figure 12: ODB Event Banner Format
__________________________(ODB 10.0.A: Event)

* Time   :  0.0741848742007 sec, [00d 00h 00m 00s . 074ms 184us 874ns 201ps]
* Event  :  execution ID (12), schedule ID (#20), type (stream intrpt)
* Source :  execution ID (11), top.pksw2.node1.proc (processor)
* Data   :  instrm (0), packet ID (0)
> Module :  top.pksw2.node1.xmt (pt-pt transmitter)
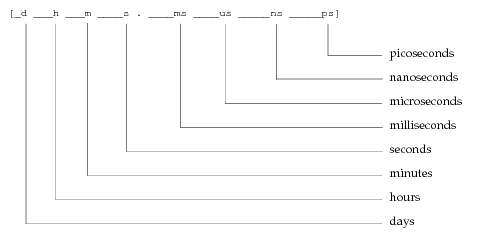
The first line of the event banner (labeled "Time") displays the simulation time in two formats. The first is a double-precision representation of the time value in seconds. The second format is a separation of the time value into standard timecode units, in the format illustrated below.
Figure 13: Event Banner Timecode Format
The second line of the event banner (labeled "Event") displays identification information for the event, including the execution ID, schedule ID, and interrupt type of the event. The execution ID is a sequential index based on the order in which events will occur. The schedule ID is a sequential index based on the order in which events were scheduled. For example, the fifth event to be scheduled in a simulation would have a schedule ID of 5, regardless of how many events actually occur before it. The execution ID and schedule ID typically do not have the same value. An event's schedule ID remains constant while it awaits execution, but its execution ID may change if other events are later scheduled to occur before it. Schedule ID numbers are always preceded by a number sign (#) to distinguish them from execution ID numbers.
The interrupt type field of the banner will take on one of the following values:
- access intrpt
- begin sim intrpt
- end sim intrpt
- esys interface intrpt
- failure intrpt
- multicast intrpt
- procedure call intrpt
- process intrpt
- recovery intrpt
- regular intrpt
- remote intrpt
- self intrpt
- statwire intrpt
- stream intrpt
The third line of the event banner (labeled "Source") displays information about the origin of the pending event. The two fields displayed are the execution ID of the precursory event that caused the current event to be scheduled, and the full name of the module associated with the precursory event. This information can be used to trace backwards in time from the current event, along the "chain" of all precursory events.
The fourth line of the event banner (labeled "Data") displays information carried along with the event. In this example, the stream index and packet ID of an arriving packet are associated with the event. The format of this line will vary depending on the type of event. Procedure call, process, remote, and self interrupts display a user-defined code in this line; if you have defined an "Interrupt Code Map" in the Process Editor, a text label will be displayed with the integer value.
The fifth and last line of the event banner (labeled "Module") displays the full name of the module targeted by the event. A module's full name specifies the hierarchical "path" to that module from the top level of the network model. The path consists of the module's name, the name of the surrounding node, and the names of all surrounding subnets (if the module's node is contained in the top level of the network model, its subnet name is simply "top"). In the example event banner on the previous page, the surrounding subnet name is pksw2, the surrounding node name is node1, and the module's name is xmt. The module type is displayed in parentheses (in this example, the module is a point-to-point transmitter).
New breakpoints can be set whenever the ODB prompt appears. Note that in ODB commands, the term "breakpoint" is not actually used. Instead, the synonym "stop" is the term that appears within command names. For example, the command to set a breakpoint for a particular event is named evstop. ODB supports commands for setting breakpoints that are trapped based on a particular event, time, process, module, or combination of module and interrupt type.
Table 7: Basic Breakpoint-Setting Commands
| "comstop" | Sets breakpoints for specific transmissions and receptions. |
| "esastop" | Causes a cosimulation to return to the external code after the current event. |
| "evstop" | Sets a breakpoint for a specified pending event. The breakpoint will be trapped immediately prior to the event's execution. |
| "interfacestop" | Sets a breakpoint for values written to a specified esys interface in a cosimulation. The breakpoint will stop the simulation when a value arrives at the specified interface. |
| "intstop" | Sets a breakpoint for a specified type of interrupt at a specified module. The breakpoint will be trapped immediately prior to the interrupt delivery. |
| "mstop" | Sets a breakpoint for all interrupts delivered to a specified module. The breakpoint will be trapped immediately prior to the interrupt delivery. |
| "pkstop" | Sets a breakpoint for a specific packet. The breakpoint will be trapped immediately prior to the execution of each event that deals with that packet. |
| "prostop" | Sets a breakpoint for all invocations of a specified process. The breakpoint will be trapped immediately prior to the process invocation. |
| "tstop" | Sets a breakpoint for a specified time. The breakpoint will be trapped immediately prior to the execution of the first event which occurs later than the specified time. |
The basic breakpoints described above are trapped based on fairly coarse conditions. Getting ODB to stop in exactly the right location within a simulation may require the successive trapping of several of these breakpoints, possibly followed by some single-event execution via the next command. For instance, if it is desired to stop a queueing process just when it finishes processing a packet from a particular input stream, a breakpoint would be set on the queue via mstop and repeatedly trapped until a packet arrives on the desired stream. Then a breakpoint would be set via evstop for the self-interrupt scheduled to indicate the packet is done processing.
There is another class of breakpoint, known as a labeled breakpoint, that supports conditional trapping based on process actions. These permit a single breakpoint to directly trap a complex condition with pinpoint accuracy. In addition, labeled breakpoints permit expected breakpoint locations in process models to be predefined and tagged for convenient later use in ODB. Labeled breakpoints are set in ODB by commands that take a label argument.
Note: The labels used for breakpoints exist in a different space from those used by labeled traces. Traces and breakpoints can have labels with the same name, but they do not affect each other.
A labeled breakpoint is trapped when a process invokes the KP op_prg_odb_bkpt() with a label which matches a pending breakpoint set in ODB. Thus, the trapping conditions of labeled breakpoints are defined by the combination of process actions and ODB commands.
Figure 14: Labeled Breakpoint in Process State
/* Acquire an Ethernet frame. */
eth_pkptr = op_pk_get (LOW_LAYER_INPUT_STREAM);

/* Extract the frame’s address. */
op_pk_nfd_get (eth_pkptr, "dst_addr", &dest_addr);

/* If this is a broadcast packet, define a breakpoint. */
if (dest_addr == ETH_MAC_BROADCAST_ADDR)
   op_prg_odb_bkpt ("eth_bcast_pk");
Several versions of labeled breakpoint commands exist; these parallel some of the basic breakpoint commands.
Table 8: Labeled Breakpoint-Setting Commands
| "lstop" | Sets a labeled breakpoint that will be trapped upon any invocation of the KP op_prg_odb_bkpt() with a matching label. |
| "mlstop" | Sets a labeled breakpoint that will be trapped upon invocations of the KP op_prg_odb_bkpt() with a matching label (restricted to a specific module). |
| "prolstop" | Sets a labeled breakpoint that will be trapped upon invocations of the KP op_prg_odb_bkpt() with a matching label (restricted to a specific process). |
Setting a breakpoint using one of the above commands adds it to the list of pending breakpoints maintained by ODB. The breakpoint list is used by ODB to determine when to halt simulation execution; the list can be displayed by the status command, as shown below. The number that appears on the left side of each line of the list is the breakpoint ID, which is used to identify a specific breakpoint to ODB commands that modify breakpoints.
Table 9: Breakpoint List Command
| "status" | Displays the lists of pending breakpoints, traces, and actions. |
Figure 15: Breakpoint List Display by Status Command
ODB> status

Breakpoints :
   0  stop at time = (150) sec.
   1  stop at event (45)
   2  stop at label (txl) in module (top.f_0.p_1)
...
A breakpoint can be active or suspended. An active breakpoint halts simulation execution when its associated conditions are present. A suspended breakpoint is temporarily deactivated, so that it does not halt simulation execution even when its associated conditions are present. Breakpoint suspension and activation allows users to turn breakpoints on or off without having to fully recreate them. Breakpoints can be deleted from the list before or after they have triggered. Note that time-specific breakpoints set by tstop are automatically deleted from the breakpoint list when triggered. ODB supports commands for activating, suspending, and deleting breakpoints.
Table 10: Breakpoint Modification Commands
| "actstop" | Reactivates a specified suspended breakpoint. |
| "delstop" | Deletes a specified breakpoint from the list of pending breakpoints. Can also delete all breakpoints from the list. |
| "suspstop" | Suspends a specified breakpoint, preventing it from being trapped until reactivation. |