Using Traces in ODB
A trace in ODB is primarily a list of the functions (both KPs and certain custom functions) invoked by a process in response to an event or invocation. Traces are used to observe the execution of process logic in a dynamic simulation context, to gauge the progress of a process’ execution, and to verify the argument and return values of process-invoked functions. Traces provide information on three kinds of invocations:
- KPs
- User-defined functions that include the FIN/FOUT/FRET macros
- Processes
Trace Output Formats
The format of trace information for a single KP invocation is shown in Figure 16. Tracing output is suppressed for secure process models when the user has only “use” access; in this case, a message states that the model is protected.
Figure 16: ODB KP Invocation Trace Format
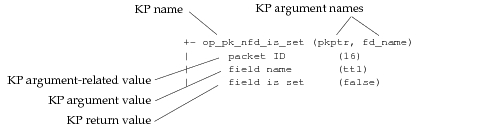
A KP trace typically displays the following items:
- the KP name
- a list of the KP argument names
- the values of the KP arguments (except in cases where their printed values are of little value, such as for pointers)
- values directly related to KP arguments (such as a packet ID representing the value of an argument that is a packet pointer)
- the return value of the KP (in cases when a value is returned)
If you include FIN/FOUT/FRET macros in the functions you define, these functions will also appear in traces. Unlike KPs, only the FIN text is automatically shown in the trace. To display argument and return values from user-defined functions, you can use the op_trace… KPs described in Chapter 25 “Trace Package” on page 1.
Note: Besides being used for function tracing, FIN macros also are required in process model code to allow access to state variables (unless the “no_fin_required_for_state_vars” preference is set to TRUE).
In addition to function-specific information, traces include information about the processes being executed. When a traced process is invoked, its model name is displayed. When the enter executives or exit executives of a process state begin traced execution, the state name and executive title are displayed. Examples of these process-related messages appear in Figure 17.
Figure 17: ODB Process Message Format
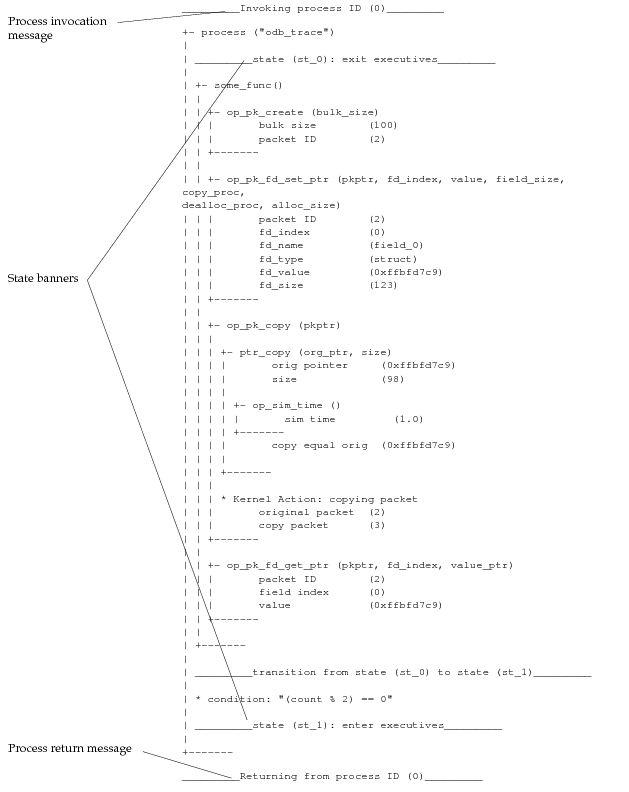
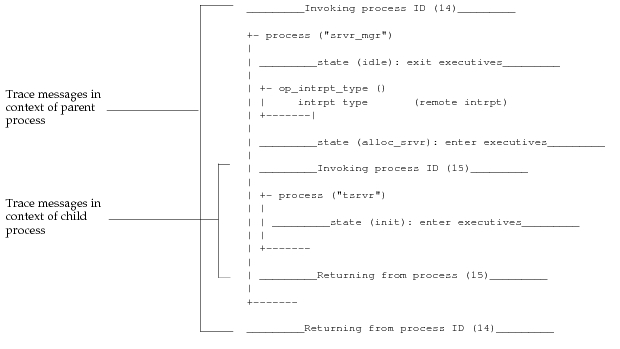
If a trace is set for a particular module, it will include trace information on all processes invoked in the module (this is also true if global tracing is enabled). If such modules include processes that invoke child processes, the trace output will include nested process invocation and return messages, as shown in the listing below.
Figure 18: ODB Nested Process Messages
Built-In Traces
The generation of trace output in ODB can be enabled or disabled for all functions. However, tracing is a much more useful tool if it is only enabled when a function is being executed under certain conditions (such as invocation within a particular module or by a particular process). By restricting tracing to focused conditions, a large number of non-interesting trace messages can be avoided. As with breakpoints, new traces can be set whenever the ODB prompt appears. ODB supports commands that can be used to set traces restricted to particular modules, processes, packets, or groups of packets known as packet trees.
Table 11: Basic Trace-Setting Commands
| "encaptrace" | Enables encapsulation tracing, which automatically turns on tracing for a packet (packet B) if a traced packet (packet A) is set as one of packet B’s fields. |
| "exectrace" | Enables execution tracing, which generates special tracing information after each event. |
| "fulltrace" | Toggles between enabled or disabled global tracing of function invocations (initial mode is disabled). |
| "icitrace" | Sets a trace for functions that involve a specified ICI. |
| "interfacetrace" | Sets a trace for functions applied to a specified interface of an external system. |
| "mtrace" | Sets a trace for functions invoked within a specified module. |
| "mttrace" | Sets the trace printout mode for the parallel kernel. |
| "pktrace" | Sets a trace for functions that are applied to a specified packet. |
| "protrace" | Sets a trace for functions invoked by a specified process. |
| "pttrace" | Sets a trace for functions applied to any packet belonging to a tree of packets (packet trees are defined as a group of packets, all of which have been derived from an original source packet via copying). |
| "ptrtrace" | Controls how traces display pointers. |
| "tracefmt" | Switches between the indented trace format shown in Figure 17 and the flat format used prior to release 10.0. |
User-Defined Traces
The output derived from the basic traces described above is determined by ODB, and only displays information on function invocations and process state boundaries. Information that remains hidden includes the values of process temporary and state variables, and the results of process statements that do not invoke functions. To obtain this type of information within ODB, user-defined trace statements can be added to a process model. User-defined trace statements can be formatted to conveniently summarize relevant process information for quick evaluation, and may be simple or complex.
- Simple trace statements typically display messages or variable values in the style of ODB using the KPs
op_prg_odb_print_major()andop_prg_odb_print_minor(), or for more format flexibility, via the C function printf(). - Complex trace statements can perform special diagnostic operations including invoking KPs and user-defined functions, and can actually change the state variables of the processes being traced.
User-defined traces can be controlled within ODB by labeled traces, which are enabled using one of several commands that parallel some of the basic trace commands.
Note: The labels used for traces exist in a different space from those used by labeled breakpoints. Traces and breakpoints can have labels with the same name, but they do not affect each other.
For user-defined trace statements to be controlled from ODB, they must check for the existence of a labeled trace using the KP op_prg_odb_ltrace_active(), as shown in Figure 19. This function returns a Boolean value (0 or 1).
Figure 19: User-Defined Trace Statements in Process State
/* Print trace information if enabled. */
if (op_prg_odb_ltrace_active ("tcp"))
   {
   sprintf (msg0, "Removing connection (%d) from TCB list.", conn_id);
   op_prg_odb_print_minor (msg0, OPC_NIL);
   }
Table 12: Labeled Trace-Setting Commands
| "ltrace" | Sets a trace for a specified label. Only invocations of op_prg_odb_ltrace_active() with a matching label return 1. |
| "mltrace" | Sets a trace for a specified label restricted to a specified module. Only invocations of op_prg_odb_ltrace_active() with a matching label within the specified module return 1. |
| "proltrace" | Sets a trace for a specified label restricted to a specified process. Only invocations of op_prg_odb_ltrace_active() from the specified process with a matching label return 1. |
Controlling Traces
As with breakpoints, setting a trace using one of the commands in Table 12 adds it to the list of pending traces. ODB uses the trace list to determine which functions are indicated via trace messages, and which invocations of op_prg_odb_ltrace_active() will return 1. The number that appears on the left side of the list is the trace ID, which is used to identify a specific trace to ODB commands that modify traces.
Table 13: Trace List Command
| "status" | Displays the lists of pending breakpoints, traces, and actions. |
Figure 20: Trace List Display By status Command
ODB> status

...

Traces :
   0)  trace on label (x_requests)
   1)  trace on module (top.f_0.p_1)
   2)  trace on packet with ID (46) (packet not in system)
Traces are similar to breakpoints in having one of two statuses: active or suspended. An active trace displays trace messages or enables a process to execute user-defined trace statements when its associated conditions are present. A suspended trace is temporarily deactivated, so that it does not display trace messages or enable trace statements even when its associated conditions are present. Trace suspension and activation allows users to turn traces “on” or “off” without having to fully recreate them. Traces can be deleted from the list at any time. ODB supports commands for activating, suspending, and deleting traces.
Table 14: Trace Modification Commands
| "acttrace" | Reactivates a specified suspended trace. |
| "deltrace" | Deletes a specified trace from the list of set traces. Can also delete all traces from the list. |
| "susptrace" | Suspends a specified trace, preventing it from displaying output until reactivation. |
You can also suspend and reactivate tracing from within your code, using the KPs op_trace_suspend() and op_trace_resume(). This can help you focus on the issues of interest by skipping trace output for long sequences of similar calls, such as when iterating through a Prg list.