Miscellaneous ODB Features
In addition to the major features of ODB (commands that manipulate breakpoints, traces, maps, diagnostic blocks, scripts, memory tagging, and memory source tracing), there are several other commands that provide valuable services. These remaining commands are organized into three groups:
- memory allocator commands are concerned with tracking the use of the memory allocator built into the Simulation Kernel; commands exist to display allocator statistics and to display lists of allocation sources and deallocation sinks
- entity information commands are concerned with displaying or modifying information about a specified entity
- miscellaneous commands are basic utilities of ODB which provide necessary environment functions
Memory Allocator Commands
The Simulation Kernel memory allocator is responsible for allocating memory for static simulation entities (such as nodes and modules), dynamic simulation entities (such as packets and ICIs), and user-defined entities via the KP op_prg_mem_alloc(). The memory allocator system includes the ability to collect several types of information about its internal operations, and display them within ODB. High-level statistics are collected for each category of memory, and include the number of objects reserved, in use, and freed, and the total amount of memory committed to each category. A list of allocator statistics, possibly limited to only those categories with significant amounts of memory, can be displayed via the memstats command. More detailed information about memory allocation and deallocation is available in ODB via the memsrc and memsnk commands. These commands display lists of allocation sources (memsrc) and deallocation sinks (memsnk) for a specified memory category; each source or sink is identified by a procedure call stack list which can indicate the process models or Simulation Kernel mechanisms responsible for dynamic memory use.
Note: The memsrc and memsnk commands are only functional in ODB if a simulation is invoked with the mem_track preference set to TRUE.
Table 21: Memory Allocator Commands
| "memsnk" | Displays a list of memory deallocation sinks for a specified memory category. |
| "memsrc" | Displays a list of memory allocation sources for a specified memory category. |
| "memstats" | Displays a list of high-level statistics for memory categories. The list can be limited to those categories which account for more than a specified amount of memory. |
Entity Information Commands
Simulation entities can be categorized as dynamic or static. Dynamic simulation entities such as packets are created and destroyed as a simulation progresses. Static simulation entities such as modules are fixed components in the network model hierarchy. The internal state memory of both dynamic and static simulation entities can change during the course of the simulation. Tracking the state changes of certain objects is an important tool in the debugging process, and it can often uncover improper operations applied to entities. ODB provides several commands which can display the current state of simulation entities as described in the table below. A command for directly modifying the state of an object is also provided.
Table 22: Entity Information Commands
| "attrget" | Displays the current value of an attribute of a specified object. |
| "attrprint" | Displays a list of information about the internal state of a specified attribute. The list includes type, value, properties, and symbol map. |
| "attrset" | Assigns a new value to an attribute of a specified object. |
| "intdisprint" | Displays a list of disabled interrupts. |
| "objid" | Displays the object ID of a specified object that is identified by its full name. |
| "objcount" | Displays a count of all objects in the network model, broken down by type. |
| "objprint" | Displays a list of information about the internal state of a specified object. The list contents depends on the type of object, but attribute values are included for all objects. Processes and queues provide the most information, including active processes, interrupt controls in effect at processes, interrupt registrations and priorities, and statistic values. |
| "ovisprint" | Displays a list of information about a specified OVIS object. |
| "pkprint" | Displays a list of information about the internal state of a specified packet. The list includes field values, IDs, stamp times and locations, sizes, and trace flags. |
| "proprint" | Displays information about a process instance. |
| "simprint" | Displays the value of selected simulation attributes. |
Wireless Debugging Commands
Wireless simulations often are difficult to debug because capturing a problematic transmission can be time consuming, requiring careful tracing and many simulation runs. ODB simplifies this process by providing the ability to record a history of wireless transmissions and view them in the debugger.
Because recording transmission history can be memory intensive, this feature is turned off by default. You can turn on recording with the xmiton command and limit the amount of data recorded with the xmitlimit command. Recorded information can be viewed in the console (using the xmitprint command) or under the Wireless Xmit tab in the graphical ODB mapping pane (by right-clicking a transmitter or receiver channel in the treeview).
Table 23: Wireless Debugging Commands
| "xmitlimit" | Sets or displays the limit on the number of recorded transmissions for specified channels. |
| "xmitoff" | Disables recording of transceiver activity history. |
| "xmiton" | Enables recording of transceiver activity history. |
| "xmitprint" | Displays the recorded wireless transmissions for a specified object. |
Figure 27: Wireless Xmit Tabbed Page
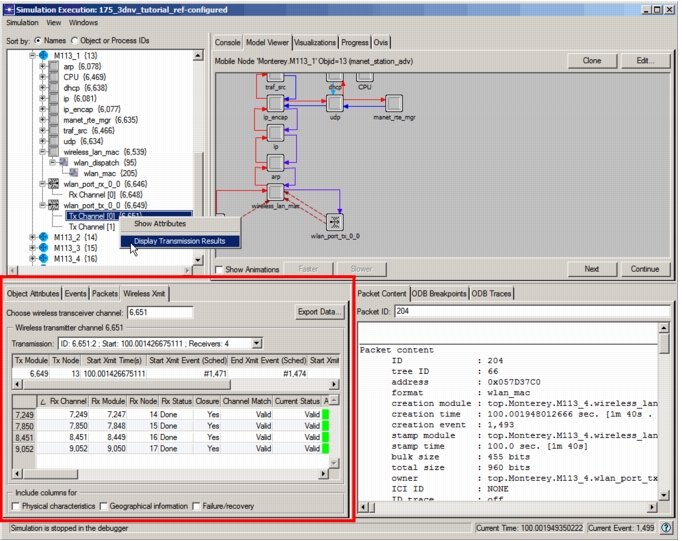
On the Wireless Xmit tabbed page, you can
- view the contents of a packet listed in the Wireless Xmit history by clicking the packet ID (if the packet still exists in the simulation; packets not in the system are listed in italics)
- display additional information about the transmission by selecting the Physical characteristics, Geographical information, or Failure/recovery checkboxes
- Export the data to a tab-delimited text file by clicking the Export Data… button
Miscellaneous Commands
ODB includes some features that are common to many command interpreters, including features for exiting the environment, obtaining help, and manipulating the history list of previous commands. These features are implemented by the remaining ODB commands, which are listed in Table 24.
Exiting ODB results in the termination of the associated simulation, which affects the collection of output statistics. There are three options available with respect to output vector files: the quit command terminates the simulation and creates an output vector file, the exit command terminates the simulation without creating an output vector file, and the snapshot command generates an intermediate output vector file without exiting. The latter can be used to generate several intermediate datasets during the course of a simulation.
Table 24: Miscellaneous Commands
| "!" | Repeats the last recorded historical ODB command which matches the specified command name. |
| "evthreads" | Displays a list showing what each thread of a parallel simulation is doing. |
| "exit" | Exits ODB and the simulation without creating an output vector file. |
| "help" | Displays a summary of help information for ODB, or information about a specified ODB command or category of commands. |
| "history" | Displays the history list of past ODB commands. |
| "pagesize" | Sets the number of lines that ODB will display at a time. |
| "quit" | Exits ODB and the simulation, and creates an output vector file. |
| "snapshot" | Generates an intermediate output vector file. |
| "where" | Generates a function call stack. |