Using Memory Source Tracing
Memory source tracing provides a way of discovering the origin of allocated blocks of memory in all or specific memory categories. It is useful for identifying and locating memory leaks (as is Using Memory Tagging). Memory source tracing is available only with sequential development kernels. It generates a list that contains a function call stack (FCS) for each function that has allocated currently active memory blocks of the specified memory categories.
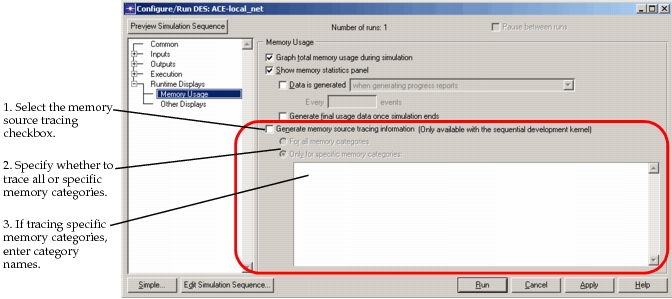
To generate memory source trace information, you must enable this feature on the Memory Usage page of the Configure/Run DES dialog box before starting a simulation, as shown in Figure 23. You can generate information for all memory categories or only specified ones.
Figure 23: Enabling Memory Source Tracing
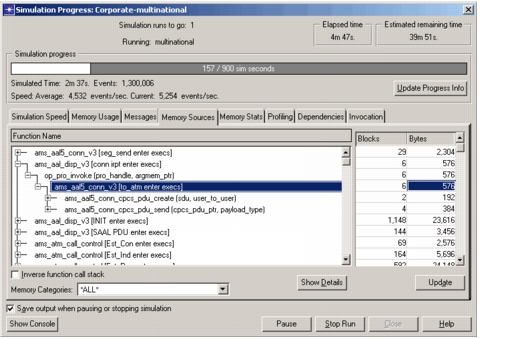
The memory source information collected by this feature appears on the Memory Sources tabbed page of the Simulation Progress dialog box (Figure 24).
Figure 24: Memory Sources Page (Simulation Progress Dialog Box)
Note: Memory source information is available only while a simulation is running (including while paused from the Simulation Progress dialog box). You cannot update this information while a simulation is stopped in ODB (at a breakpoint, for example).
Each row of the tree on the Memory Sources page shows a unique function call stack for a function that has allocated one or more blocks of currently active memory from one of the specified memory categories. You can sort the tree by clicking on one of the column heads (Function Name, Blocks, or Bytes).
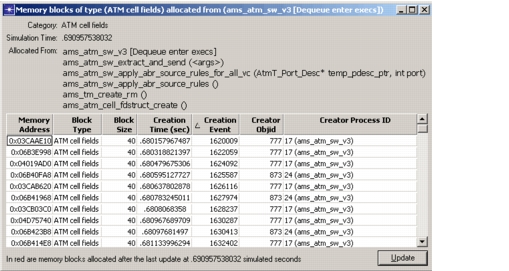
Right-clicking on a row (or selecting a row and clicking the Show Details button) opens a dialog box containing a table of all individual memory blocks allocated by the corresponding portion of the function call stack (Figure 25). An examination of this information can sometimes point to the existence of a memory leak; for example, if blocks are still active a suspiciously long time after they were allocated. You can use the information in this table to set useful breakpoints in ODB to help locate memory leaks.
Figure 25: Detailed Information Dialog Box
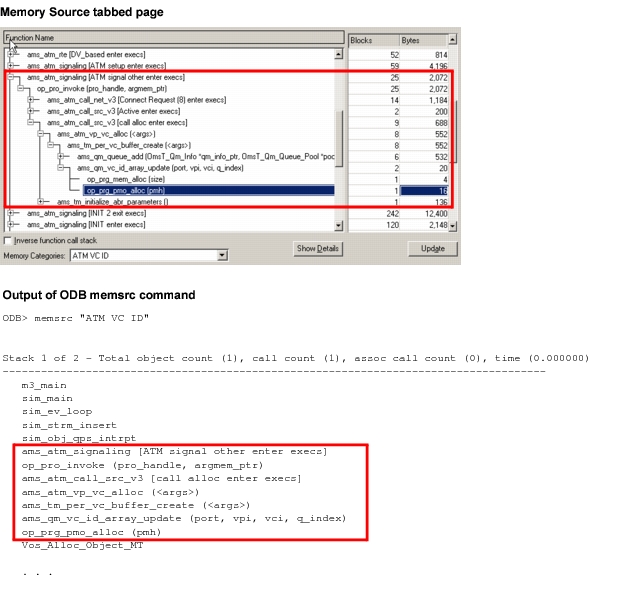
If all you need is a function call stack, you can get this information directly in ODB with the memsrc command (described in "memsrc" on page 123). Figure 26 compares the information available from memory source tracing and the memsrc command.
Figure 26: Comparison of Memory Source Tracing and ODB memsrc Command