Simulation Execution Dialog Box (Advanced)
When you run a simulation with the OPNET Debugger (ODB), the Simulation Execution dialog box is expanded to present additional information about the simulation. (The basic version of this dialog box is described by “Simulation Execution Dialog Box” on page 407.)
Figure 1: Simulation Execution Dialog Box (Advanced)
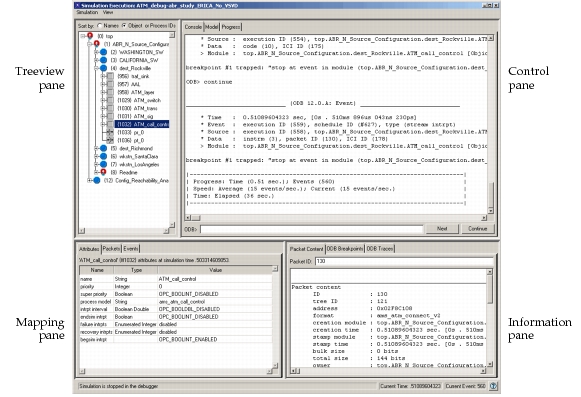
The advanced Simulation Execution dialog box (also known as the graphical debugger) is composed of four panes:
- Treeview Pane – contains a hierarchical view of the topology of the network being simulated.
- Control Pane – contains tabbed pages for the Simulation Console, graphical views of the model, and the Simulation Progress display.
- Mapping Pane – contains various tabbed pages that list object attributes, packets, events, and other information.
- Information Pane – contains various tabbed pages that describe packet fields, breakpoints, traces, and (during source-level debugging) local and state variables.
You can configure the appearance of the advanced Simulation Execution dialog box using the Graphical Debugger Preferences.
In any of these panes, left- or right-clicking on something makes corresponding changes in other panes (when appropriate). For example, selecting a module name in the treeview displays the node model on the Model page of the control pane (with the clicked module selected) and shows the module attributes on the Attributes page of the mapping pane. For more details, see Pop-Up Menus.
Treeview Pane
The treeview pane of the advanced Simulation Execution dialog box (upper left) contains a hierarchical view of the topology of the network being simulated. Left-click on an item in the tree (node, module, etc.) to display that object in the model view. Right-click on an item in the tree to open a pop-up menu with operations related to that item, such as viewing attributes or setting breakpoints.
Control Pane
The control pane of the advanced Simulation Execution dialog box (upper right) contains tabbed pages used to control and monitor the status of the simulation.
- Console – displays the Simulation Console, which lets you enter debugger commands and control execution of the simulation. See Simulation Console (ODB) or Simulation Console (ODB and Source-Level Debugger) for details.
- Model Viewer – displays an animated view of simulation flow through the network, node, and process models. As the simulation runs, this page displays the model being simulated and the flow of packets through the model. You can change the animation speed (which affects simulation speed), open the model in the Node or Process Editor, or clone the pane to keep a separate view of the current display.
- Visualizations – displays information about the current state of the network by using built-in or user-created visualizations. See Debugger Visualizations for details about using and creating visualizations.
- Progress – displays the same detailed information about the progress of a discrete event simulation as the Simulation Progress dialog box (see “Simulation Progress Dialog Box” on page 407 for details).
- 3DNV/Ovis – displays information about Ovis objects. This page is available only when the simulation is producing output for 3D Network Visualizer (either live or for an animation history file). On this page:
- The Find Next field searches for a case-sensitive substring in the current object tree.
- Viewmode is the current viewmode as set by the simulation. If the simulation is connected to a live 3D Network Visualizer (not a history file), the actual 3DNV viewmode might be different because of user interaction.
Mapping Pane
The mapping pane of the advanced Simulation Execution dialog box (lower left) contains various tabbed pages of information about object attributes, packets, and events. In addition:
- When a source-level debugger is attached, a tabbed page listing local and global variables is included.
- When the Wireless module is available, a tabbed page displaying information about recorded wireless transmissions is included. See “Wireless Debugging Commands” on page 62 for details.
Packets and events can be filtered in various ways, such as by creator or owner, and sorted by clicking in a column heading. Right-click on some items in the lists (such as object IDs or simulation times) to open a pop-up menu with operations related to that item, such as viewing attributes or setting breakpoints.
Information Pane
The information pane of the advanced Simulation Execution dialog box (lower right) contains various tabbed pages of information about packet fields, breakpoints, and traces. On the Packet Content page, enter a packet ID or click on a packet in the model view to see the contents of that packet’s fields. On breakpoint and trace pages, you can click in an Enabled cell to toggle the breakpoint or trace on and off. Disabled breakpoints and traces appear in italic font.
Menus
The advanced Simulation Execution dialog box has two pull-down menus and a variety of pop-up menus.
Simulation Menu
The Simulation menu contains various operations that control execution of the simulation.
Table 1: Simulation Menu Operations
| Operation | Description |
|---|---|
| Continue Break |
Resumes execution of a paused simulation or pauses a running simulation at the end of the currently executing simulation event. |
| Stop | Terminates the simulation. |
Attach <source-level debugger>Detach <source-level debugger> |
Attaches or detaches a source-level debugger, either CDB (on Windows) or GDB (on Linux). |
| ODB Next | Steps the simulation through the next (pending) simulation event. Same as entering the ODB next command. |
| ODB Break | Pauses the simulation at the end of the currently executing simulation event. |
| Source Next | Executes the next source line in the simulation, but doesn’t enter functions. Same as entering the next command in GBD or the P command in CDB. |
| Source Step | Executes the next source line in the simulation, entering functions when encountered. Same as entering the step command in GBD or the T command in CDB. |
| Restart… | Restarts the currently running simulation, stopping at time 0. All ODB breakpoints (including expired ones) and active traces are preserved. If there is an active source debugger, it is attached to the new simulation with its breakpoints and other settings preserved. |
| Save Console… | Saves the Simulation Console display to a text file. |
| Checkpoint… | Checkpoints the simulation (Linux only; checkpoint feature must be enabled). |
View Menu
The View menu lets you switch the view to various tabbed pages, such as the Packets, ODB Breakpoints, or Simulation Progress pages. These operations are equivalent to clicking the corresponding tab. The View menu also lists keyboard shortcuts for changing the view.
Pop-Up Menus
Shortcuts to simplify debugging are available through pop-up menus in the advanced Simulation Execution dialog box. You can set breakpoints, perform traces, and display object-specific information by right-clicking on various items in the dialog box, such as:
- Module names in the Treeview pane
- Sites, modules, packets, and statistic wires in the model view
- IDs and simulation times in packet and event lists