Simulation Console (ODB and Source-Level Debugger)
A source-level debugger (GDB on Linux or CDB on Windows) can be attached to a simulation via the GUI (see Attaching GDB to a Simulation or Attaching CDB to a Simulation for details). When this is done, the Simulation Console expands to add control of the source-level debugger and a source code display.
Figure 3: Simulation Console for ODB and Source-Level Debugger
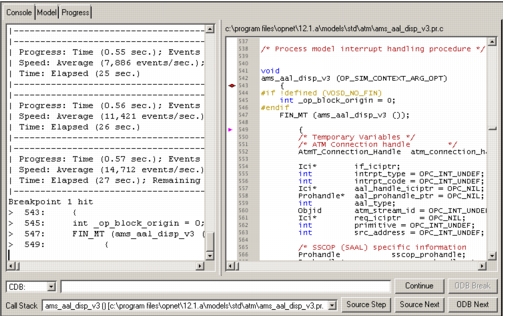
Table 3 lists the controls in the ODB and source-level debugger Simulation Console.
Table 3: Simulation Console (ODB and Source-Level Debugger) Controls
| Control | Description |
|---|---|
| Console display | Displays status, simulation progress, and error messages generated by the simulation program, as well as all debugger commands that you enter and the responses to them. |
| Command line | Used to enter ODB and source-level debugger commands. By default, commands entered here are sent to the debugger identified by the pull-down menu to the left of the command line. You can temporarily specify a different debugger by preceding a command with the debugger name (“odb”, “gdb”, or “cdb”). When the cursor is in the command line: • The up-arrow and down-arrow keys scroll through a list of previously issued commands. • Typing some text brings up the most recent command that begins with that text. The portion not typed is highlighted and will be replaced by any additional typing. Use right-arrow to go to the end of the text. Backspace deletes the last character typed and a new match is not shown until another character is typed. • The Tab key (when the command line contains some text) cycles through matching commands in the list of previous commands, if any. When there is no text in the command line, the Tab key moves the focus to another control. Thus, you can enter a command, press Return to have the command processed and to clear the field, then press Tab to go to the next or some other control. |
| Continue button | Resumes execution of the simulation. Same as entering the ODB or GDB continue command or the CDB go command. |
| ODB Break button | Pauses the simulation at the end of the currently executing simulation event. |
| Call Stack pull-down menu | Lists recently called functions. When the simulation is stopped, the current function is selected in the list. If you select a different function from the list, the corresponding source code will be shown in the Source Code display (if available). |
| Source Step button | Executes the next source line in the simulation, entering functions when encountered. Same as entering the step command in GBD or the T command in CDB. |
| Source Next button | Executes the next source line in the simulation, but doesn’t enter functions. Same as entering the next command in GBD or the P command in CDB. |
| ODB Next button | Steps the simulation through the next (pending) simulation event. Same as entering the ODB next command. |
| Source Code display | Displays the source code associated with the current breakpoint and the function selected in the call stack. Breakpoints are indicated by either a filled arrow (active) or a hollow arrow (disabled). You can set and clear breakpoints by clicking to the left of a line number. Note: Only model code can be viewed here; source code from the simulation kernel is not available. |
In addition to the changes in the Simulation Console, additional information is displayed in the Mapping and Information panes.
Table 4: Source-Level Information Pages
| Tabbed Page | Description |
|---|---|
| Local and State Variables | Displays information about variables in the source code. Variable types are indicated by font, as follows: • Bold – state variable • Plain – local variable • Italic – function argument Note: State variables show random values until execution reaches the FIN statement. |
| Source Breakpoints | Displays breakpoints set by the source-level debugger. Breakpoints can be enabled and disabled. |