Debugger Visualizations
ODB visualizations provide a way to view the status of protocols as a simulation progresses. You can use visualizations as debugging tools or to monitor performance of a protocol. Any information that you can access via an ODB command is available for display in a visualization.
Riverbed Modeler comes with a built-in visualization for checking IP routing in a subnetwork. This is described in Built-in Debugger Visualizations.
[use this when more built-ins are added] Riverbed Modeler comes with several built-in visualizations, such as one that displays IP routing in a subnetwork. For descriptions of these, see Built-in Debugger Visualizations.
You can write your own visualization plug-ins, as described in Writing Custom Debugger Visualizations.
Visualizations are available from the Control Pane of the graphical debugger. The general workflow for using a visualization is
- While running a simulation in the graphical debugger, click the Visualizations tab.
- On the Add Visualization tabbed page, select a visualization from the pull-down menu and, if desired, enter a name to use on the visualization's tab.
- Click the Display This Visualization button to open the visualization in a new tabbed page.
- Interact with the visualization as appropriate.
Add Visualization Tabbed Page
The Add Visualization tabbed page lets you display visualizations and edit the list of available visualizations. This page is always available under the Visualizations tab.
Figure 4: Add Visualization Tabbed Page
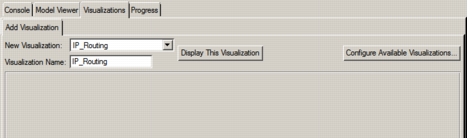
Table 5 lists the controls on the Add Visualization tabbed page.
Table 5: Add Visualization Tabbed Page Controls
| Control | Description |
|---|---|
| New Visualization | Pull-down menu used to select one of the available visualizations for display. |
| Visualization Name | Text entry field used to specify a name for the visualization tab. |
| Display This Visualization | Opens the selected visualization in a new tabbed page, with the specified name. |
| Configure Available Visualizations… | Lets you specify which visualizations are available for viewing. See Configure Debugger Visualizations Dialog Box for details. |
Configure Debugger Visualizations Dialog Box
This dialog box lets you add visualizations to the list of those available for viewing. It is most often used to make a new custom visualization available.
Figure 5: Configure Debugger Visualizations Dialog Box
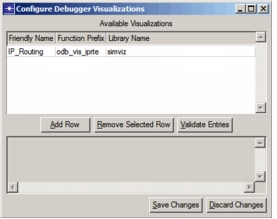
Table 6 lists the controls on the Configure Debugger Visualizations dialog box.
Table 6: Configure Debugger Visualization Dialog Box Controls
| Control | Description |
|---|---|
| Friendly Name | Name to be used in the GUI for the visualization. |
| Function Prefix | Common prefix used in the names of all functions implementing the visualization. |
| Library Name | Name of the library containing the visualization functions. |
| Add Row | Adds a row to the Available Visualizations table so that a new visualization can be specified. |
| Remove Selected Row | Removes the selected visualization from the table. |
| Validate Entries | Tests each visualization in the table to verify that it is accessible. The status of each visualization is displayed in the bottom pane. Use this button after adding new visualizations to the table. |
| Save Changes | Saves a list of available visualizations to the Debugger Visualizations preference. |
| Discard Changes | Closes the dialog box without changing the available visualizations. |