Built-in Debugger Visualizations
The following visualization plug-in is shipped with Riverbed Modeler.
IP_Routing
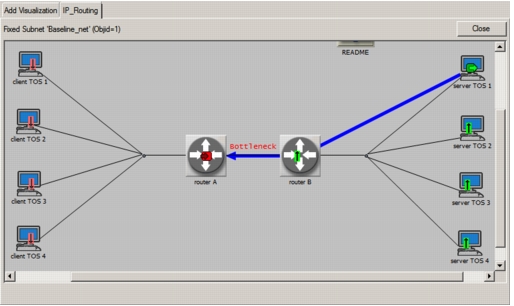
The IP_Routing visualization lets you examine IPv4 reachability within a subnetwork.
Figure 6: IP_Routing Visualization
To use this visualization:
Procedure 9: Using the IP_Routing Visualization
-
Click on a source node.
Result: The selected node is labeled with a green endpoint icon. The other nodes in the subnet are labeled to indicate their reachability from the selected node (green up-arrow if reachable; red down-arrow if not reachable).
-
Click on a destination node.
Result: This node is labeled with a red endpoint icon. The route between the two endpoints is displayed. (A partial route is displayed in red if the complete route is not known.)
-
Click on another node to change the destination, or click in the workspace to clear the labels and start over.