Visualize Routes
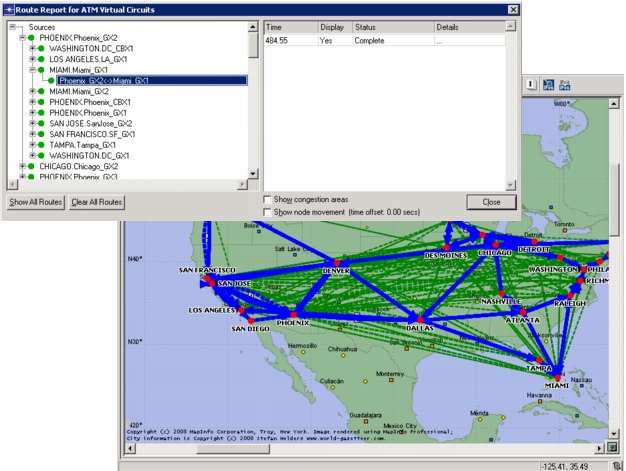
Riverbed Modeler offers several methods to visualize routes after you run Flow Analysis. These methods are described below.
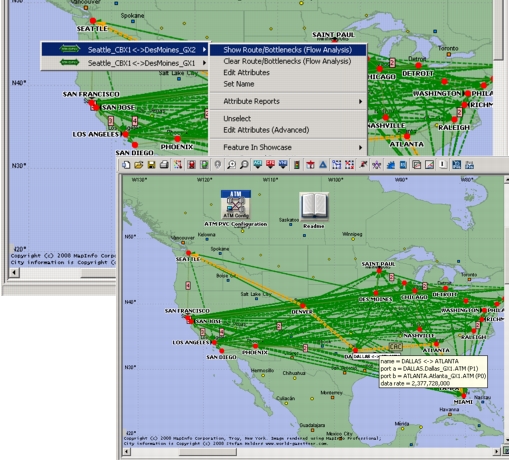
As shown in the figure below, you can right-click on an ATM circuit and select Show Routes/Bottlenecks (Flow Analysis). The entire path is shown, and the bottleneck link is shown, if the circuit could not be routed. Place your cursor over the route to see more information.
Figure 107: Show Route/Bottlenecks
You can also run an analysis of the routes between a given source and destination node by selecting both nodes and choosing Flow Analysis > Show Routes Between Selected Nodes. Rather than displaying all routes, it lets you focus on a single path between two nodes in the network.
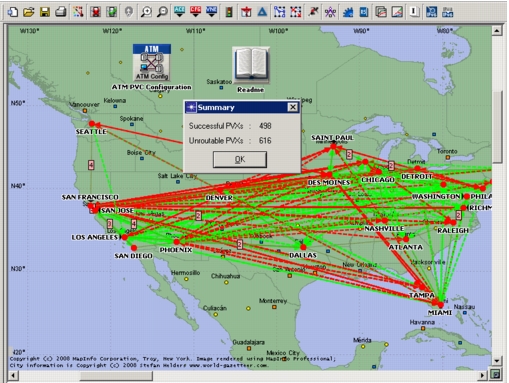
If you want to analyze the routability of your ATM circuits, select Protocols > ATM > Visualize the Routability of PVXs. See Figure 108 for an example.
Figure 108: Visualize the Routability of PVXs
When you run a discrete event simulation, you can visualize the routes the circuits are taking by selecting Protocols > ATM > Display ATM VC Routes. An example is shown in Figure 109.
Figure 109: Display ATM VC Routes