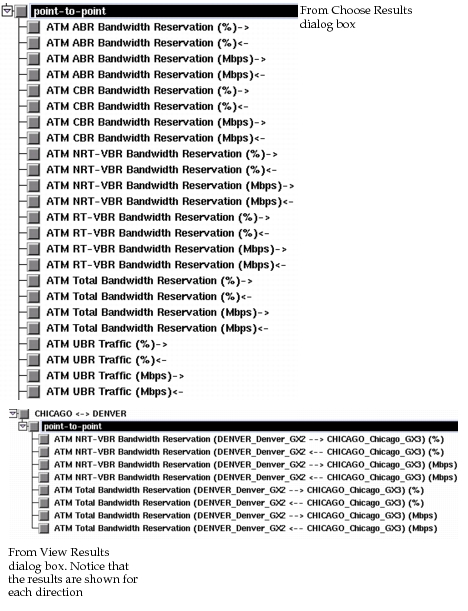
Analyzing ATM Networks
Available Statistics
Discrete event simulation statistics that can be collected from the ATM model suite are categorized into three groups:
- ATM: this group contains general ATM statistics
- ATM VC: this group contains connection-based statistics to evaluate the load, throughput and utilization on a per-VC level
- ATM Switch: this group contains numerous switch-related statistics to study the traffic flowing through the switch as well as the queue lengths and queuing delays.
Figure 101: Available Statistics in the ATM Model Suite
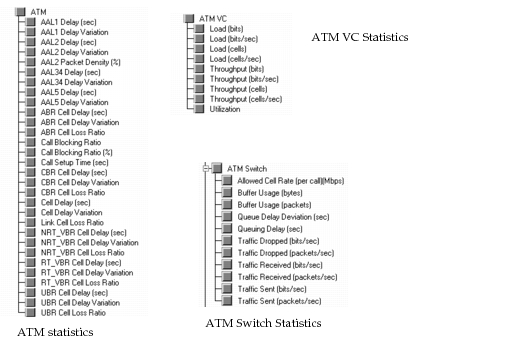
Figure 101 shows the interface to set up statistic probes before a simulation. The following diagram shows the interface seen when viewing results for the ATM Switch statistics after a simulation. Note that queue lengths are displayed for each port and each queue (these map to the queue numbers configured in the port buffer configuration attribute). Results are displayed according to queue type, servicing scheme, service category and port numbers.
Figure 102: Viewing Results for ATM Switch Simulations
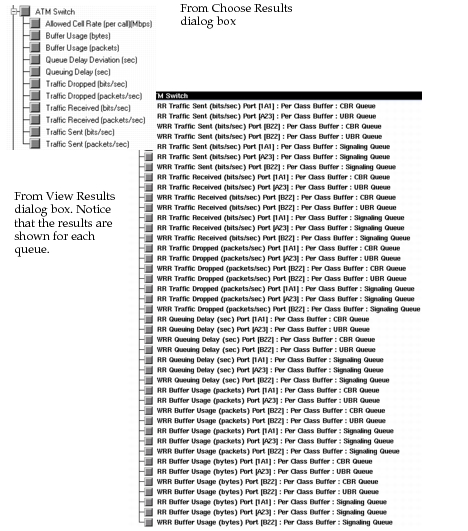
Figure 102 shows the interface for viewing the results for connection-based statistics after a simulation. Note that each statistic is annotated and shows the statistic (load, throughput, and so on), type of connection (PVC, SVC, and so on), call reference number (to differentiate multiple connections), and node names of the conversation pair (n1 --> n2 for load and n1 <-- n2 for utilization and throughput, if viewing the results from node n1).
Figure 103: Annotated Results for Connection-Based Statistics