Visualization of Multicast Demands (Flow Analysis)
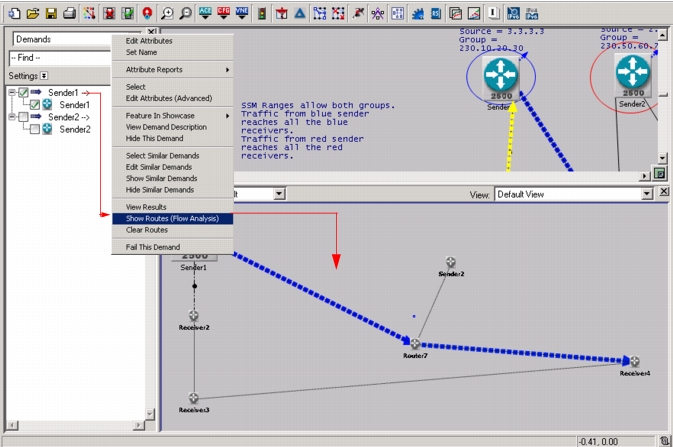
You can visualize the route taken by multicast demands by using the right-click menu option "Show Routes (Flow Analysis)", as shown in the following figure.
Figure 229: Visualize Multicast Demand Routes
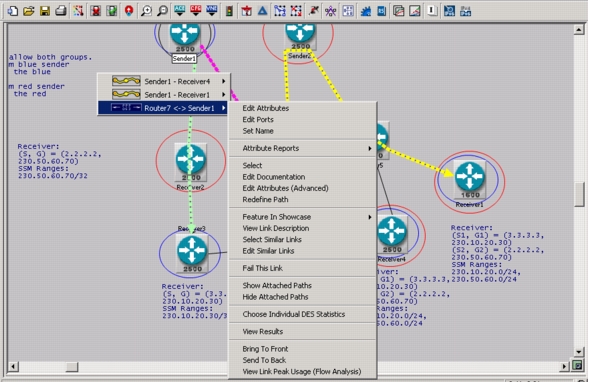
You can also view downstream nodes from any point along a path of a multicast traffic flow. Visualize the tree as described in Procedure 57, and then right-click on a demand, as shown in Figure 230. Note that the lines representing the demands become more green as they extend further (more hops) away from the source. Lines become thicker, the more downstream nodes they contain.
Figure 230: Visualize Downstream Nodes in Multicast Model