Radio-Air Interface
The Wireless module includes 13 pipeline stages to model the radio interface. You can model the air interface between the UE and the UTRAN by modifying some of these pipeline stages.
To model specific W-CDMA behavior, the following pipeline stages must be modified:
Received Power
The standard received power pipeline stage (dra_power.ps.c) is modified to include a path loss model and shadow fading model that depends on the environment (pedestrian outdoor, vehicular outdoor, indoor office).
The propagation path loss models are based on formulas specified by the International Telecommunications Union as shown below (Recommendation ITU-R M.1225 Guidelines for Evaluation of Radio Transmission Technologies for IMT-2000, 1997). The Hata model for frequency between 1500 MHz and 2000 MHz and the free space model are also supported. Shadow fading is modeled as a log-normal distribution with zero mean and a standard deviation depending on the environment but settable by the operator. The environment is settable by the operator.
Path Loss Models
Modeler provides the following three models that let you simulate path loss for certain environments:
Vehicular Outdoor

where R is the distance between the mobile station and base station in kilometers, Δh_b is the base station antenna height (meters), and freq is the carrier frequency in MHz.
Pedestrian Outdoor

where R is the distance between the user and base station in kilometers, freq is the carrier frequency in MHz, and L_pMax is valid in non-line-of-sight case and describes worst case propagation.
Indoor Office
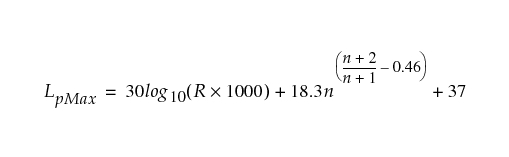
where R is the distance between the user and base station in kilometers, n is the number of floors in the path, and L_pMax is valid in non-line-of-sight case and describes worst case propagation.
Background Noise
The background noise pipeline stage (dra_bkgnoise.ps.c) includes thermal noise and noise figure of the mobile and base station receiver.
Interference Noise
Interference noise is calculated in the following pipeline stages.
- RACH and AICH channels:
umts_ue_dra_inoiseumts_utran_dra_inoise
- DCH and FACH channels:
umts_ue_dra_powerumts_utran_dra_power
Bit Error Rate
The bit-error rate pipeline stage (dra_ber.ps.c) is modified to include the signal-to-noise ratio (SNR) versus block error ratio (BLER) curves that depend on the coding scheme and rate and transmission time interval for each transport channel, and the transport format combination chosen. The model supports convolutional codes rate half and rate third in AWGN and in multipath conditions with three equal paths and assumes perfect power control. Bounds on the BLER have been developed under these different conditions. These bounds have then been verified using detailed link-level simulations (to the chip level) of the W-CDMA air interface for uplink and downlink reference measurement channels as specified in 3GPP TS 25.101 (see Reference Documents).
Error Probability Bounds for Convolutional Coding
A convolutional code has a “transfer function”.
Figure 604: Transfer Function for Convolutional Code

The coefficient  is the number of alternative paths through trellis which differ in
 coded bit positions from the correct path;
 is sometimes called the Hamming distance between the two paths (or more precisely, between the code vectors associated with the paths).
The lower limit  is known as the free distance, which is the minimum Hamming distance between the two alternative paths.
The exponent  is the number of information bits that differ between two paths, which differ by a Hamming distance of
 .
The union bound is an upper bound on the total probability of error. Assuming coherent detection and soft-decision Viterbi decoding, the union bound on the probability of choosing the wrong path through the trellis at a given stage is
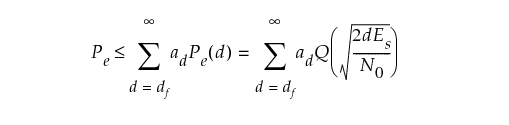
where

If  is the code rate,
 , where
 is the energy per symbol (coded bit) and
 is the energy per data bit.
 is the two-sided noise power spectral density, assumed to include other-user interference as well as thermal noise.
For a rate 1/n code, each stage in the trellis corresponds to a data bit (n coded bits), so the union bound on the block error probability, for a block of B bits, is

The union bound on the bit error probability is

where  .
The coefficients  and
 depend on the specific code.
Clearly the larger the free distance  , the better the code performance in general.
For rate-1/2 code: 
For rate-1/3 code: 
The coefficients  and
 are shown for the two codes in the tables below, and Figure 605 shows the union bounds on block error rate vs. E_b/N_0 for a block length of
 bits, for the two rates.
Table 236: Transfer Function Coefficients for Rate-1/2 Convolutional Code
 |
 |
 |
|---|---|---|
| 12 | 11 | 33 |
| 14 | 50 | 281 |
| 16 | 286 | 2179 |
| 18 | 1630 | 15,035 |
| 20 | 9639 | 105,166 |
| 22 | 55,152 | 692,330 |
| 24 | 320,782 | 4,580,007 |
| 26 | 1,859,184 | 29,692,894 |
| 28 | 10,777,264 | 190,453,145 |
Table 237: Transfer Function Coefficients for the Rate-1/3 Convolutional Code
 |
 |
 |
|---|---|---|
| 18 | 5 | 11 |
| 20 | 7 | 32 |
| 22 | 36 | 195 |
| 24 | 85 | 564 |
| 26 | 204 | 1473 |
| 28 | 636 | 5129 |
| 30 | 1927 | 17,434 |
| 32 | 5416 | 54,092 |
| 34 | 15,769 | 171,117 |
As can be seen, the curves can be closely approximated by first-order regression lines of the form:

where  and
 are as shown in the graph below.
Since the bound on  is proportional to the block length
 ,

and

Thus, in terms of the specific coefficients derived from the curves,

For a specific target block error rate, therefore, the required is closely approximated as:

Figure 605: Block Error Rate (Union Bound) for Rates 1/2 and 1/3 Convolutional Codes
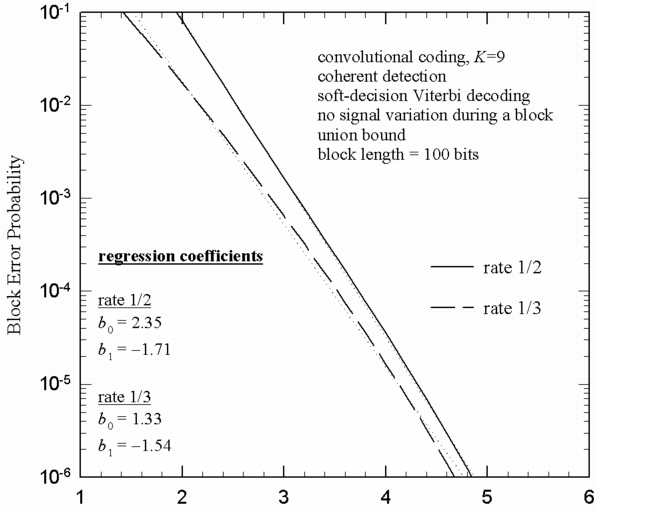
For the specific cases of interest here, this becomes:
Figure 606: Rate 1/2

Figure 607: Rate 1/3