Displaying Sensor Volumes
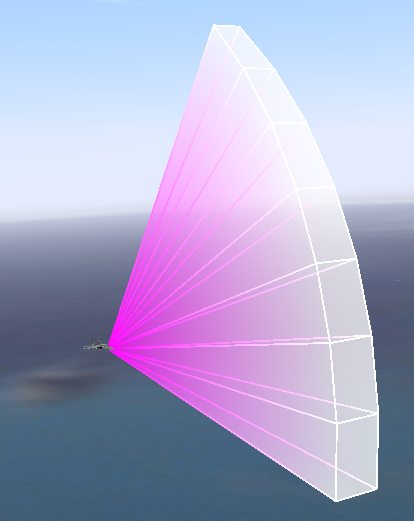
3D Network Visualizer can display sensor volumes for entities that have emitter systems (Figure 68). You can configure the colors used to represent emitter frequencies and you can configure the size of the sensor volumes.
Figure 68: Sensor volumes
Procedure 78: Enabling or Disabling Display of Sensor Volumes
- Choose Settings > Display. The Display Settings dialog box opens.
- Select the Entity Display Settings page (Figure 59).
- Select or clear the Show Sensor Volumes checkbox.
Note: You can also enable or disable sensor volumes by choosing Settings > Sensor Volumes, or clicking the Sensor Volumes icon (
) on the Display Settings Toolbar.
Configuring Sensor Volumes
You can configure how 3D Network Visualizer colors sensor volumes, how they are drawn, and how they are scaled for visibility. You can configure sensor volumes by editing the DefaultEllipsoidArc model definition or by creating customized ellipsoid arc model definitions and applying them to different entity models.
Configuring Sensor Volume Color
By default, sensor volumes are displayed using fixed colors for high frequency and low frequency. You can configure sensor volumes to be colored based on the emission frequency or pulse rate. When sensor volume color represents frequency, color is determined by the frequency field of the EM Emission update message. In both cases, you specify a low frequency or pulse rate value and a high value.
If the emitter frequency or pulse rate is lower than your specified low value, the sensor volume is red. As frequency rises above the specified low value, sensor volume color changes, progressing through the colors of the visible spectrum until the specified high value is reached. At the high value and above, the sensor volume is violet.
To change coloring from the default, you must add the appropriate attributes to the sensor volume visualizer for the entities whose model definitions you want to change. Table 4 describes the sensor volume visualizer attributes that affect sensor volume color.
Table 4: Sensor Volume Visualizer Attributes
| Attribute | Description |
|---|---|
| colorByFrequency | If True, color by frequency instead of using static colors. |
| lowFrequency | The low frequency threshold for coloring by frequency. Default: 800 MHz. |
| highFrequency | The high frequency threshold for coloring by frequency. Default: 1 GHz. |
| usePulseFrequency | If colorByFrequency is True and usePulseFrequency is True, color sensor volumes by pulse frequency. |
| lowPulseFrequency | The low pulse rate threshold for coloring by frequency. Default: 100 Hz. |
| highPulseFrequency | The high pulse rate threshold for coloring by frequency. Default: 3 KHz. |
Controlling Sensor Volume Radius
A sensor volume’s radius (that is, the distance it extends from the emitter) is based in part on emitter power and in part on elevation and azimuth sweep data obtained from EM-Emission state messages. A higher emitter power value results in a longer radius, while a wider field of view results in a shorter radius (because the radiated power is distributed over a wider area).
If 3D Network Visualizer relied exclusively on these values, the range of sizes among different sensor types could become too wide to be practical, with some emissions being barely visible, and other emissions covering the entire virtual world. Therefore, a configurable exponent weight and scale factor have been added to help fine tune the emitter beam radii. The radius exponent weight (a value between 0 and 1) slows the growth of the radius when power or area is greater than 1 and increases the growth of the radius when power or area is less than 0. The scale factor increases the radii of all beams by the given value.
To change the scale factor and exponent from the default, you must add one or both of the following attributes to the sensor volume visualizer for the entities whose model definitions you want to change:
- linearScale. The amount of linear scaling applied to all sensor volumes. Default: 100.
- exponentialScale. The amount of exponential scaling applied to sensor volumes: Default: 0.1.
How 3D Network Visualizer Calculates the Radius
3D Network Visualizer calculates sensor volume radius by approximating the spread of the emissions based on the elevation and azimuth sweeps. If the approximate coverage is zero, it sets the value to 1. Then it applies the linear and exponential scaling values. The code for implementing this is as follows:
double tempVar = 8*elevationSweep*sin(2*azimuthSweep);
if (tempVar <=0) tempVar=1.0;
scale = linearScale * pow(sqrt(power/tempVar), exponentialScale );
Configuring Sensor Volume Segments
3D Network Visualizer displays a sensor volume as a group of spherical sections projecting from the sensing device. By default, for each 10 degrees (or portion thereof) in the sensor’s field of view, 3D Network Visualizer draws one segment. The figure shows segments set to 10° (the default) and 30°.
Figure 69: Sensor volume segments
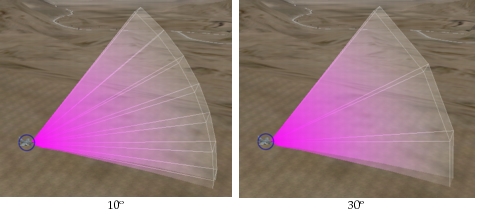
Sensor volume segments are managed by the EllipsoidArc schema and model definitions based on it. 3D Network Visualizer ships with one ellipsoid arc model definition – DefaultEllipsoidArc. You can edit this model definition or create copies of it and customize them. If you want to have different sensor volumes for different entities, assign a different ellipsoid arc model definition to each one.
Specifying the Segment Angle
Procedure 79: Specifying the Segment Angle
- Choose Settings > Visual Model Editors. The Visual Model Editors dialog box opens.
- Select the Model Definition Editor page.
- Click the Filter icon (
 ) and select EllipsoidArc. The ellipsoid arc model definitions are listed in the window.
- Select DefaultEllipsoidArc.
- Change the value of the
angleSegmentMaxparameter. The minimum value is 10 (degrees); the maximum is 45.
Displaying Segment Outlines
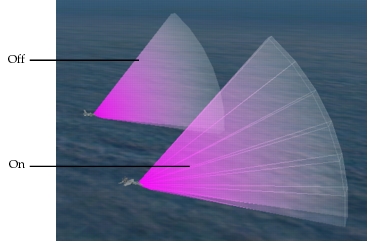
By default, 3D Network Visualizer displays opaque outlines showing the segment edges along the surface of the sensor volume.
Figure 70: Segment outlines
Procedure 80: Displaying or Hiding Segment Outlines
- Choose Settings > Visual Model Editors. The Visual Model Editors dialog box opens.
- Select the Model Definition Editor page.
- Click the Filter icon (
 ) and select EllipsoidArc. The ellipsoid arc model definitions are listed in the window.
- Select DefaultEllipsoidArc.
- Change the value of the
showLinesparameter.
Adding a Custom EllipsoidArc Model Definition
If you want to customize the segment angle and segment outlines for a particular entity without changing the values for other entities, you must create a separate ellipsoid arc model definition and add it to the entity’s model definition.
Procedure 81: Creating a Custom Ellipsoid Arc Model Definition
- Choose Settings > Visual Model Editors. The Visual Model Editors dialog box opens.
- Select the Model Definition Editor page.
- Click the Filter icon (
 ) and select EllipsoidArc. The ellipsoid arc model definitions are listed in the window.
- Select DefaultEllipsoidArc.
- Click the Duplicate Model Definition icon (
 ). The Duplicate Model Definition dialog box opens with a default definition name.
- Accept the generated name or type a new name for the model definition.
- Click OK. The model definition is added to the list.
- Change the parameter values for the new model definition as desired.
- Select the Entity Definition Editor page.
- Select the entity whose sensor volume you want to change.
- Select the 3D Sensor Volume visualizer for the entity.
- Click the Value column for the
modeldefinitionattribute. The Choose Model Definition dialog box opens. It has a drop-down list of model definitions. - Select the model definition that you just created.
- Click OK.
- If you are connected to an exercise, disconnect and then reconnect to enable the new model definition.