Configuring Ping Traffic
To configure ping traffic between nodes manually, use the following procedure.
Procedure 41: Configuring Ping Demands
-
Open the "demands" object palette.
-
Scroll to and select the demand "ip_ping_traffic". Drag and drop it into the project workspace.
-
Click on the source node and then the destination node in the project workspace.
Result: The ping demand is created between the source and destination nodes as a dotted line with an arrow toward the destination.
-
Edit the demand, if desired, by right-clicking on the demand and selecting "Edit Attributes" from the pop-up menu.
Figure 204: Edit Ping Demand
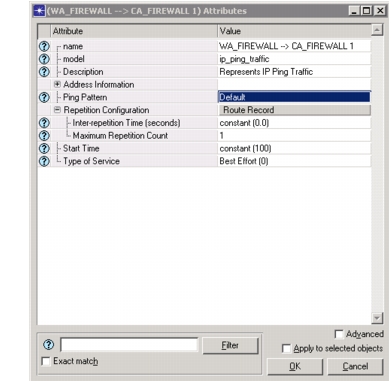
Note: If you select "Record Route" as the ping pattern, the route of the ping is viewable in the Discrete Event Tables tab of the View Results dialog box. If you select "Default" it is not.
End of Procedure 41
Ping Patterns
You can create ping patterns aside from the Record Route and Default, as described in the following procedure.
Procedure 42: Creating a Ping Pattern
-
Open the "utilities" object palette.
-
Select the "IP Attributes Config" utility and place it in the project workspace.
-
Right-click on the utility and select "Edit Attributes".
-
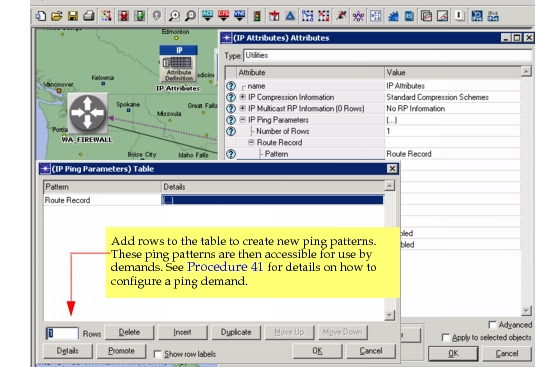
In the "Edit Attributes" dialog box, expand the "IP Ping Parameters" attribute to view the current configuration or double-click on the [...] to open the attribute table.
Figure 205: Create/Edit Ping Pattern
-
Add a row to the table.
-
Click on the value in the Pattern column to type in a new name. (Default value will be "Default").
-
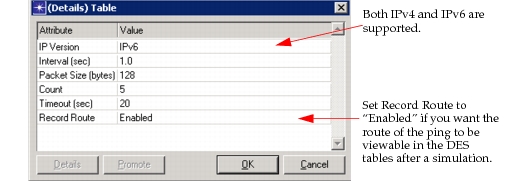
Double-click on [...] in the value in the Details column to specify the way the pattern should behave.
Figure 206: Ping Pattern Details
-
Click OK to save the details of the pattern.
-
Click OK in the IP Ping Parameters table to save the new pattern(s).
-
Click OK to close the Edit Attributes dialog box.
End of Procedure 42
Viewing Ping Results
If you want to view DES statistics for ping, use the following procedure to configure collection.
Procedure 43: Collecting ICMP Statistics
-
Select DES > Choose Individual Statistics... from the menu.
-
Select the statistics as follows
- Node Statistics > IP > Ping Replies Received (packets) and
- Node Statistics > IP > Ping Requests Sent (packets) and
- Node Statistics > IP > Ping Response Time (sec)
-
Run DES as usual.
End of Procedure 43
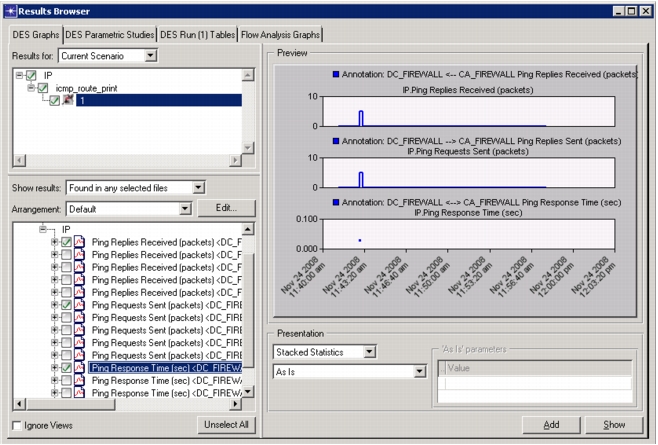
You can then view these statistics, for each ping traffic flow individually, in the DES Graphs tab of the View Results dialog box, as shown in the following figure.
Figure 207: Viewing Ping Statistics
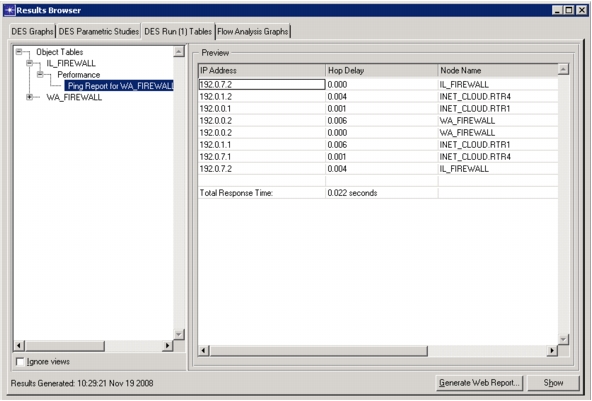
If you used "Record Route", you can see the path of the ping traffic in the Object Tables of the Discrete Event Graphs tab of the View Results dialog box, as shown in the following figure.
Figure 208: Viewing Ping Results
Note: The route of a ping is recorded only once even if the request count is more. The ping request is actually sent the number of times specified in the count. You can verify this by collecting and reviewing the ping statistics mentioned as described in Procedure 43.