Layer-2 VPN-Centric Reports and Visualization
This section describes the ways you can view and analyze Layer-2 VPNs in your network model.
Layer-2 VPN-Aware Traffic Creation Utility
A traffic creation utility makes it simple to create traffic flows for Layer-2 VPNs in the network model. Choose Traffic > Create Traffic Flows > Ethernet, as shown below.
Figure 398: Layer-2 VPN Traffic Creation
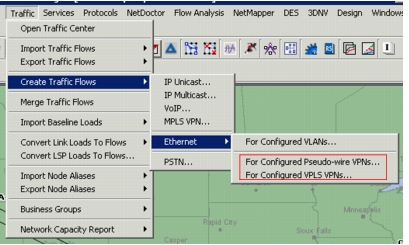
You can create traffic flows between Layer-2 VPN end-points, which are typically the PE devices offering point-to-point service using pseudo-wires, or emulated LAN service using VPLS.
Note: This utility creates Layer-2 flows that can originate and terminate on switch ports, VLAN interfaces, or sub-interfaces. The source and destination interface names and VLAN IDs are essential for routing of Layer-2 flows. These flows are different from IP flows, which typically have source and destination IP addresses and are routed using routing tables.
If you select “For Configured Pseudo-wire VPNs” or “For Configured VPLS VPNs,” the resulting dialog box will appear as shown below. Note that with these two options, you also have an “Arrange by:” choice for flow creation.
Figure 399: Creating Ethernet Traffic Flows for VPLS or Pseudo-wire VPNs
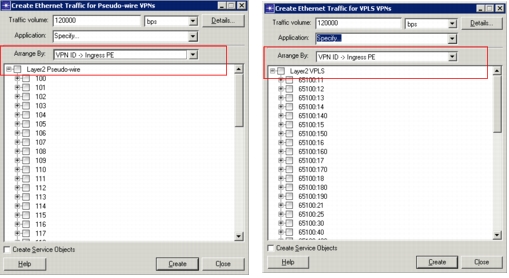
The traffic creation utility can be configured to display the VPN end-points grouped by VPN IDs or by Ingress Provider Edge (PE) Devices. For a given VPN and PE, traffic flows are created from that PE to all its peers (one or more) in the VPN. The customer-facing interface names of the PE devices are set on the traffic flows created.
Viewing Layer-2 VPNs
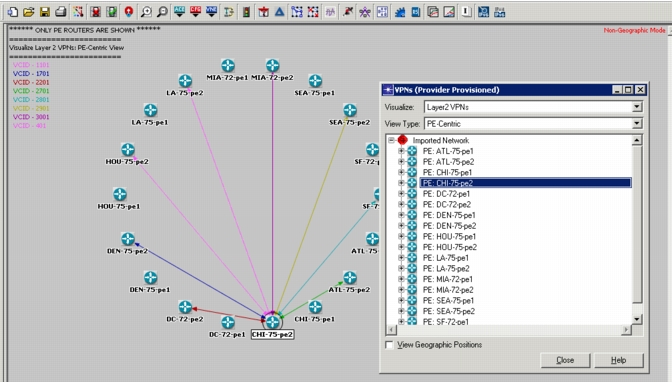
When Layer-2 VPNs exist in the network model, you can view information about the VPNs by choosing the menu option View > Set View for Network > VPNs (Provider Provisioned). Select “Layer2 VPN” in the Visualize drop-down menu. Note in the following figure that each VCID is color-coded. You can select the device to see all VCIDs, or you can expand the tree and select individual VCIDs to view.
Figure 400: View of PE-Centric Layer-2 VPNs
Layer-2 VPN-Centric Flow Analysis Reports
The following Flow Analysis reports are available for the analysis of Layer-2 VPNs:
Note: You must select these reports and run a flow analysis before you can view the Layer-2 traffic in the Traffic Center.
- Performance > Layer2 VPN Status - Pseudo-wire
- Performance > Layer2 VPN Traffic - Pseudo-wire
- Performance > Layer2 VPN Status - VPLS
- Performance > Layer2 VPN Traffic - VPLS
- Layer2 VPN Performance per Node
The status report lists all VPNs (pseudo-wire or VPLS) in the network along with their status, total traffic volume in the VPN, maximum delays, and maximum packet loss ratio in the VPN. For each one of the PEs participating in a VPN, a drill-down report is available to view the status of each component that establishes the VPN (interface, remote peer, the tunnel to the remote peer), traffic volume, packet delays, and loss ratio for traffic entering the VPN at that PE.
Viewing Layer-2 VPNs in the Traffic Center
You can view Layer-2 VPN traffic in the Traffic Center after you have run a flow analysis, using the following procedure.
Procedure 97: Viewing Layer-2 VPNs in the Traffic Center
-
Open the Traffic Center by choosing Traffic > Open Traffic Center.
-
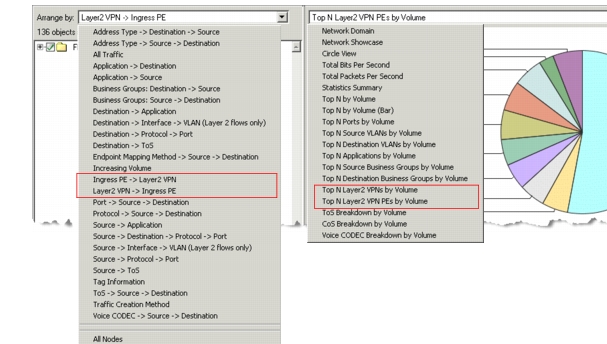
Select the desired “Arrange by:” option:
- Ingress PE -> Layer2 VPN
- Layer2 VPN -> Ingress PE
-
Select the desired view option:
- Top N Layer2 VPNs by Volume
- Top N Layer2 VPN PEs by Volume
Figure 401: Viewing Layer-2 VPNs in the Traffic Center
End of Procedure 97
Visualizing Layer-2 VPN Link Usage
You can see Layer-2 VPNs when you visualize the link usage using the following procedure.
Procedure 98: Visualizing Layer-2 VPN Link Usage
-
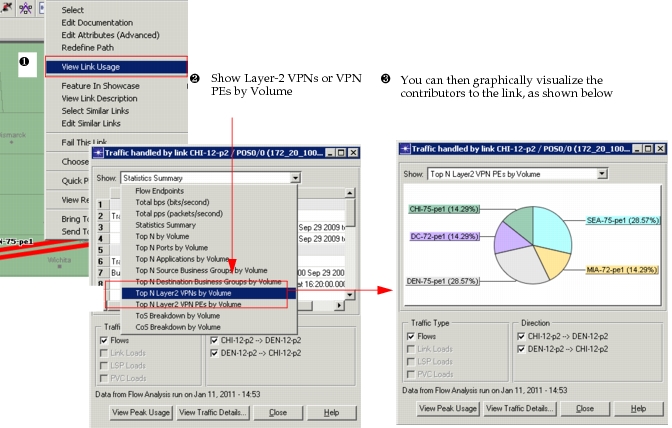
Right-click on a link and choose View Link Usage.
-
(Optional) If desired, choose a preconfigured view, as shown below.
Result: A chart visualization appears.
Figure 402: Visualize Layer-2 VPN Link Usage
-
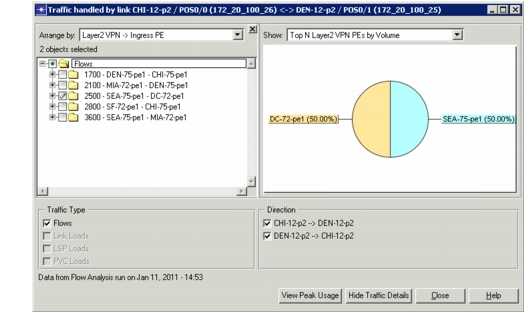
Use the “View Traffic Details...” button to see further information, as shown below.
Figure 403: Visualize Layer-2 VPN Link Usage
End of Procedure 98
Layer-2 VPN Survivability Analysis
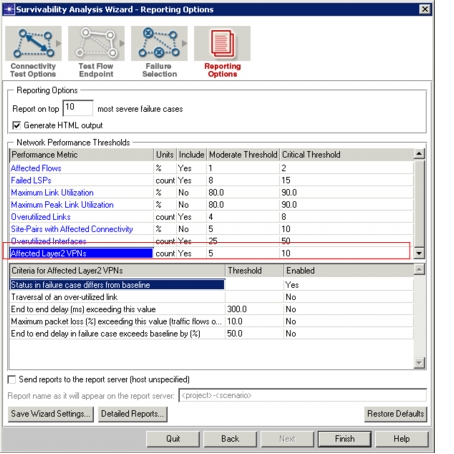
Using Survivability Analysis, you can analyze Layer-2 VPNs in the network. The wizard includes a report selection, “Affected Layer2 VPNs,” as shown below. You can enable or disable options and set thresholds to customize the results.
Figure 404: Layer-2 VPN Enhancements to Survivability Analysis Wizard
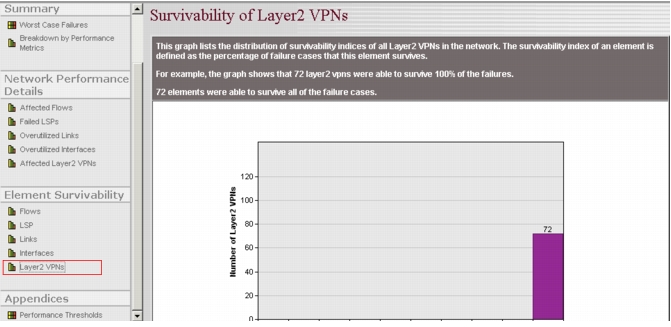
Output in the report graphically displays the survivability of Layer-2 VPNs, as shown below.
Figure 405: Layer-2 VPN Survivability Analysis—Network Performance Details
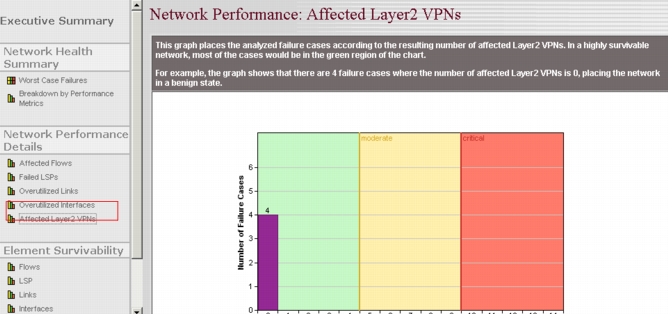
Figure 406: Layer-2 VPN Survivability Analysis—Element Survivability