Available Reports for LTE
Frame Capacity Reports
Two Frame Capacity reports—eNodeB DL Frame Capacity Report (shown below) and eNodeB UL Frame Capacity Report,—are available for the eNodeB. You can view the results in the DES run tables as shown in the following figure.
Figure 343: LTE eNodeB DL Frame Capacity Reports
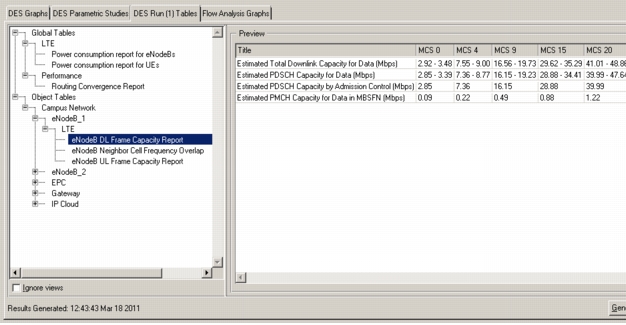
Note: In this example, additional information is shown because MBMS is configured and enabled in the network. See the “Estimated PMCH Capacity for Data in MBSFN (Mbps)” row.
The Frame Capacity Report for PDSCH shows a range of estimated data rates depending on the number of symbol times taken by PDCCH. PDCCH can take anywhere between one and three symbol times.
Neighbor Cell Frequency Overlap Report
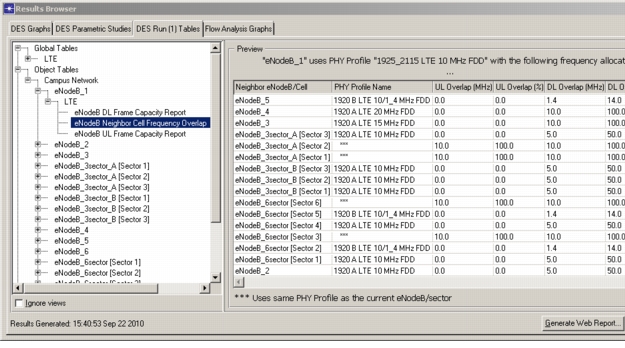
The following figure shows the eNodeB Neighbor Cell Frequency Overlap report. This report indicates the amount of frequency overlap (in MHz and percentage) with all of the other eNodeBs in the network. The corresponding PHY profiles are listed in the table, and if any eNodeB in the list uses the same profile as the eNodeB that owns the table, then *** is used instead of the name A foot note is included in the report to clarify. The overlap is reported for uplink and downlink bandwidths.
Figure 344: eNodeB Neighbor Cell Frequency Overlap Report
Power Consumption Report
The output of the power consumption feature is shown below.
Figure 345: Power Consumption Report
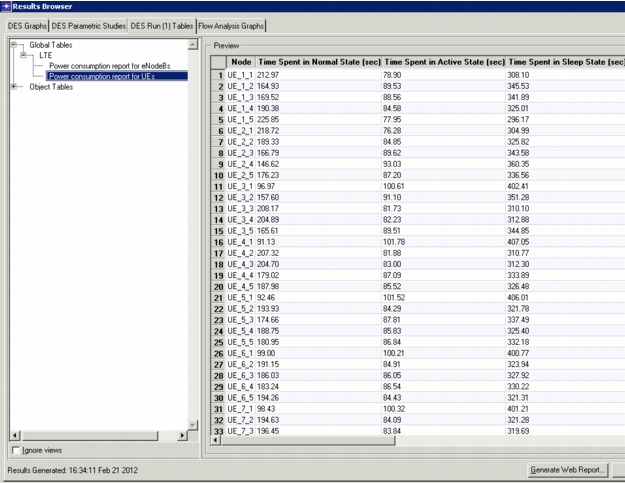
The output is in two separate tables, one for all UEs and one for all eNodeBs, which will contain the following fields calculated at the end of the simulation:
- Node – Displays the node name
- Time Spent in Normal State – Total time, in seconds, spent in the Normal (DRX Inactive) state
- Time Spent in Active State – (UE only) Total time, in seconds, spent in the DRX Active state
- Time Spent in Sleep State – (UE only) Total time, in seconds, spent in a DRX sleep cycle
- Operating Power Consumption – Total energy consumed during the simulation based on the time that the UE has spent in each state and the given operating power consumption rate for each state.
- Tx Power Consumption – Total energy consumed by all transmissions during the simulation.
- Total Power Consumption – Sum of the Operating Power Consumption and Tx Power Consumption during the simulation.
- Battery Capacity – Value of the Battery Capacity attribute is provided for reference in the output table.
- Estimated Life Time – An estimate of the time it will take for the battery to be completely depleted.