Importing Data from Different Sources
The following topics describe importing data from specific sources:
- Importing Data from Server Performance Module for HP OpenView
- Importing Data from Server Performance Module for BMC Performance Assurance (SPBMC)
- Importing Data from Server Performance Module for CA Unicenter NSM (SPCA)
- Importing Data from HP OpenView Performance Agent
- Importing Data from BMC Patrol
- Importing Data from Windows Perfmon
- Importing Data from NetIQ AppManager
- Importing from Other Data Collectors
The server performance modules (first three procedures listed above) let you import server workload data into Server Characterization Editor via a GUI-based workflow that connect directly to the data collectors. By connecting directly to the data collectors, these modules simplify the import process used for some of the other data sources by eliminating the step of extracting the server data into an intermediate file. All of the server performance modules are available as add-on (optional) modules to Server Characterization Editor.
Importing Data from Server Performance Module for HP OpenView
The Server Performance Module for HP OpenView connects directly to the OpenView Performance Agents (OVPA) on the server being studied. Using OpenView Performance Manager (OVPM) as a proxy, Server Characterization Editor queries the machine for global information, such as summary information about the system, hardware configuration information, and process or application information.
Although the Server Performance Module for HP OpenView gets the information from OVPM, the collection is performed by the OpenView Performance Agents on the individual servers, and it is important that these agents be configured appropriately. For more information about setting up and configuring OVPA, see “Configuring HP OpenView Performance Agent” on page 89.
Server Performance Module for HP OpenView: Special Requirements
The Server Performance Module for HP OpenView installs an Riverbed OVI-ICO Service. This module starts and stops this service during the import process.You must have privileges on a Windows machine for this module to work.
Note: To start and stop the Riverbed OVI-ICO Service for non-administrator users, consult your local system administrator. A system administrator can grant sufficient rights for non-administrators to start and stop the Riverbed OVI-ICO Service by using a utility called SUBINACL.exe. For more information, see the operating system documentation.
Procedure 3: Importing Data from the Server Performance Module for HP OpenView
-
From the System window, select File > New…
The New dialog box displays.
-
Click on the pull-down menu, select Server Characterization, and then click OK.
2.1 A new Server Characterization Editor window opens behind the Select a Project Template dialog box.
-
Select the template you want to use from the list, and then click on Next.
The Import Type dialog box displays.
-
Select the Server Performance Module for HP OpenView option and click OK.
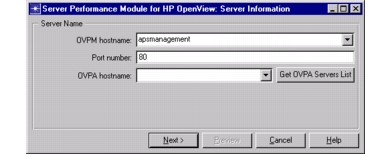
The Server Performance Module for HP OpenView: Server Information dialog box displays.
-
Select the OVPM hostname field. Enter the name of the computer running HP OpenView Performance Manager (OVPM). If necessary, enter the port number used by OVPM in the Port Number field.
-
Click on the Get OVPA Servers List button.
6.1 The OVPA Hostname drop-down menu is populated with the list of computers managed by OVPM.
-
Select the OVPA Hostname drop-down menu. Select a host from the list, or enter the name by typing it directly. Click on Next.
-
Select the metrics to preview either by selecting one of the standard metrics in the list or by clicking on Select Additional Metrics…
-
Select the preview duration by clicking on current hour, current day, or Specified Time Range. If you’ve selected Specified Time Range, you must enter a start and end time. Select Preview.
A panel will display with a graph for each of the selected metrics.
-
Determine what time period you wish to sample, and click Next.
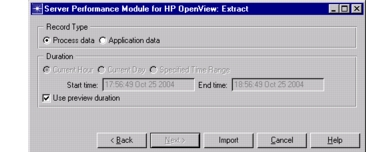
The Server Performance Module for HP OpenView: Extract dialog displays.
-
Select the type of data you wish to import. This can be process or application data.
-
Select the duration. By default this is the same as the preview duration.
-
Click Import to start the import operation and close the dialog box.
Importing Data from Server Performance Module for BMC Performance Assurance (SPBMC)
You can import data from BMC Performance Assurance using the Server Performance Module for BMC Performance Assurance. This is an optional module that you can use with Server Characterization Editor to facilitate imports from BMC Performance Assurance.
Server data collected using BMC Performance Assurance can be stored in a variety of formats. Importing data from SPBMC involves the following main steps:
- Configuring an Open Database Connectivity (ODBC) data source to access BMC Patrol collected server data
- Importing server data using System Performance Module for BMC
Configuring an ODBC Data Source to Access Server Data Collected by BMC Performance Assurance.
Before you can import data from SPBMC, you must first configure the an ODBC data source to access the server workload data collected by BMC Performance Assurance. The ODBC data source acts as a conduit for Server Characterization Editor to access server workload data directly from BMC Performance Assurance. The ODBC data source is configured with the type and location of the BMC Visualizer database.
SPMBMC lets you import server data stored in the following data sources:
- Microsoft Access Database (*.mdb)
- Microsoft SQL Server
- Oracle
The following procedure describes how to create an ODBC database that SPBMC can use to directly access the BMC Visualizer database.
Procedure 4: Creating an ODBC Data Source (Windows)
-
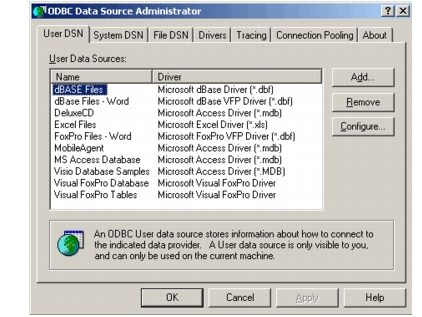
Open the ODBC Data Source Administrator.
1.1 Open the Windows Control Panel (Start > Settings > Control Panel).
1.2 Double-click on Administrative Tools.
1.3 Double-click on Data Sources (ODBC).
The ODBC Data Source Administrator appears.
Figure 10: ODBC Data Source Administrator
-
Create a new data source for the BMC Visualizer database.
2.1 On the User DSN tab of the ODBC Data Source Administrator dialog box, click Add...
2.2 In the Create a New Data Source dialog box, select the driver that corresponds to the BMC Visualizer database.
2.3 Click Finish.
Figure 11: Creating a New Data Source
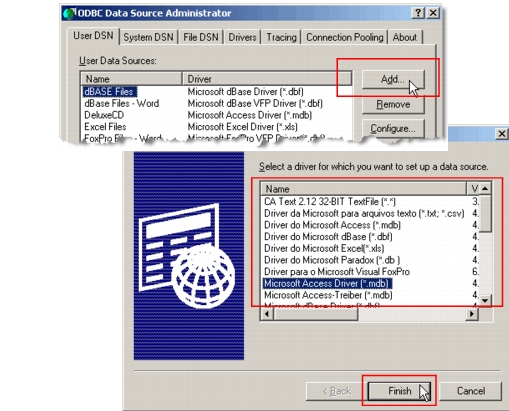
The ODBC Driver Setup dialog box appears.
-
Configure the ODBC driver.
3.1 In the ODBC Driver Setup dialog box, do the following:
- Set the Data Source Name field to BMC Visualizer.
- In the Description field, briefly describe the function of this ODBC.
3.2 Click Select… in the ODBC Driver Setup dialog box.
3.3 Browse to the location of the BMC Visualizer database and click on the database name to select it. Click OK to close the Select Database dialog box.
3.4 Click OK to close the ODBC Driver Setup dialog box.
-
Click OK to close the ODBC Data Source Administrator dialog box.
After you have configured an ODBC, you are ready to import from SPBMC.
Importing from SPBMC
The procedure for importing from SPBMC uses an ODBC to access the server workload data collected by BMC Visualizer.
Procedure 5: Using SPBMC to Import Data into Server Characterization Editor
-
From the System window, select File > New…
The New dialog box displays.
-
Click on the pull-down menu, select Server Characterization and click OK.
2.1 A new Server Characterization Editor window opens behind the Import Type dialog box.
-
Select System Performance Module for BMC Performance Assurance and click Next.
The Import Type dialog box displays.
-
Select the Server Performance Module for BMC Performance Assurance option and click OK.
Note: Optionally, you can select a template and time filter in this step before clicking OK.
Figure 12: Starting an Import Using SPBMC
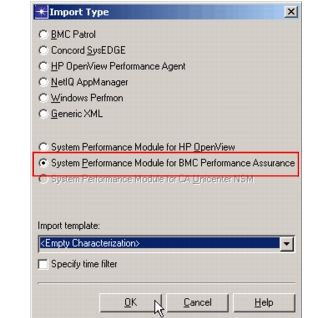
The SPBMC Datasources dialog box appears.
-
Select the name of the ODBC data source(s) you want to import from (see step 3.1 in Procedure 4). Specify a username and password, if required, for the BMC Visualizer database and click OK.
The SPBMC Systems dialog box appears with a list of the machines monitored by BMC Performance Assurance. When you select a machine, the name of the ODBC data source and the start and end times for the available data appear beneath the table.
-
Select the machine that you want to import from and click OK.
The Import Properties dialog box appears.
-
Specify the parameters in the Import Properties dialog box and click OK. The available parameters are listed in Table 3.
The SPBMC imports the workload data for the server into Server Characterization Editor.
Importing Data from Server Performance Module for CA Unicenter NSM (SPCA)
You can import data from CA Unicenter NSM using the Server Performance Module for CA Unicenter NSM (SPCA). This is an optional module that you can use with Server Characterization Editor to facilitate imports from CA Unicenter NSM. Riverbed Modeler uses the pcmtocsv function in CA Unicenter NSM during the import process. Therefore, you must have CA Unicenter NSM and the Riverbed Modeler installed on the same machine to import into Server Characterization Editor.
Procedure 6: Using CA Unicenter NSM to Import Data into Server Characterization Editor
-
From the System window, select File > New…
The New dialog box displays.
-
Click on the pull-down menu, select Server Characterization and click OK.
A new Server Characterization Editor window opens behind the Import Type dialog box.
-
Select System Performance Module for CA Unicenter NSM and click OK.
Note: Optionally, you can select a template and time filter in this step before clicking OK.
Figure 13: Starting an Import Using SPCA
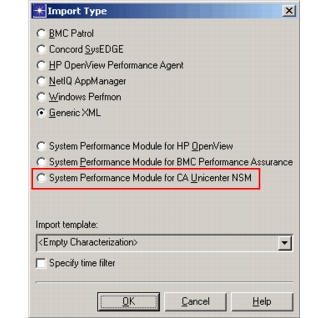
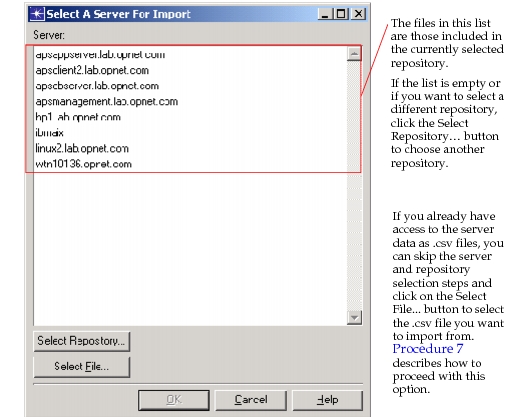
The Select a Server for Import dialog box appears with a list of the servers in the current repository.
Figure 14: Select a Server for Import Dialog Box
-
If the server you want to import is not listed in the current dialog box, select the repository you want to use.
4.1 Click the Select Repository... button.
A file browser appears with the current repository (the performance cube directory) already selected.
4.2 Navigate to the correct performance cube directory and select it. This directory is usually in the following location: C:\NSM\PERFDATA\performance_cubes.
4.3 Click OK.
The file browser closes and the Select a Server for Import dialog box lists the servers in the newly selected repository.
-
From the list of servers, select the server whose workload data you want to import and click OK
The performance cube data is converted to .csv (comma separated value) format—one .csv file per day and opens the Select Server Datafile dialog box.
-
Select the file you want to import. Additionally, some configuration information about the server that you are importing is required. Depending on the version of CA Unicenter NSM that you are running, there may be a configuration file that includes this configuration information. If so, the Configuration File field shows the file being used, but it is hard-coded and is not configurable. If the Configuration File field is blank, you will have the opportunity to manually supply the configuration information for the server in the next dialog box.
Figure 15: Selecting a .csv File for SPCA Imports
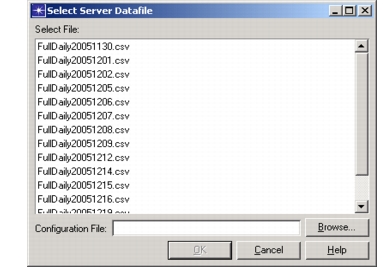
If you are using the Configuration File field, do the following:
6.1 Select the .csv file corresponding to the day you want to import.
6.2 Click OK.
The Import Properties dialog box appears.
6.3 Specify the parameters in the Import Properties dialog box and click OK. The available parameters are described in Table 3.
The SPCA imports the workload data for the server into Server Characterization Editor.
If you are not using the Configuration File field, do the following (Windows):
6.1 Select the .csv file corresponding to the day you want to import.
6.2 Leave the Configuration File field blank and click OK.
The Server Properties dialog box appears. This dialog box lets you specify the server’s configuration data.
Figure 16: Specifying Server Properties
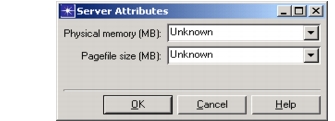
6.3 Specify the amount of physical memory and the pagefile size for the server. You can get this information from the System Information screen in Windows (Start > Programs > Accessories > System Tools > System Information).
6.4 Click OK.
The SPCA imports the workload data for the server into Server Characterization Editor.
If you are not using the Configuration File field, do the following (all except Windows):
6.1 Select the .csv file corresponding to the day you want to import.
6.2 Leave the Configuration File field blank and click OK.
The Import Properties dialog box appears.
6.3 Specify the parameters in the Import Properties dialog box and click OK. The available parameters are listed in Table 3.
The SPCA imports the workload data for the server into Server Characterization Editor.
If you have access to the server data as .csv files, you can bypass the server and repository selection steps when you get to the Select a Server for Import dialog box.
Procedure 7: Importing from .csv Files with SPCA
-
From the System window, select File > New…
The New dialog box displays.
-
Click on the pull-down menu, select Server Characterization and click OK.
A new Server Characterization Editor window opens behind the Import Type dialog box.
-
Select System Performance Module for CA Unicenter NSM and click OK.
Note: Optionally, you can select a template and time filter in this step before clicking OK.
Figure 17: Starting an Import Using SPCA
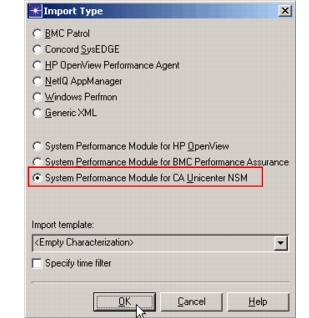
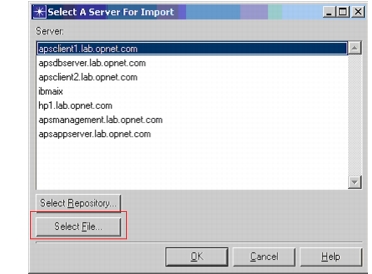
The Select a Server for Import dialog box appears with a list of the servers in the current repository.
Figure 18: Select a Server for Import Dialog Box
-
Click Select File…
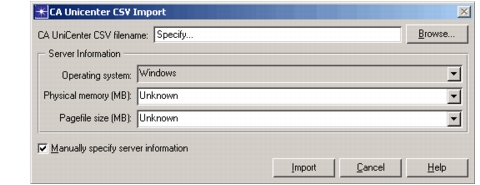
The CA Unicenter CSV Import dialog box appears.
-
Specify the .csv file you want to import from.
-
Provide configuration information for the server.
If you have access to the configuration file for the server, do the following:
6.1 Clear the Manually specify server information checkbox.
Figure 19: Using a Configuration File for .csv Imports
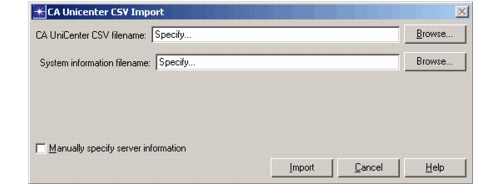
6.2 Specify the configuration file in the System information filename field.
If you do not have access to the configuration file for the server, do the following:
6.1 Specify the operating system, physical memory, and page size information for the server.
Figure 20: Manually Specifying Server Configuration for .csv Imports
-
Click Import.
The SPCA imports the workload data for the server into Server Characterization Editor.
Importing Data from HP OpenView Performance Agent
OpenView Performance Agent (OVPA) stores the data it collects in closed format files. Global information, such as summary information about the system, is stored in the logglob file. Information about specific processes is stored in the logproc file. You can also configure OVPA to group information about several processes into a single unit of information called an application, which is identified with a unique application identifier and stored in the logappl file. Other files contain information about file systems and devices.
For more information about setting up and configuring OVPA, see “Configuring HP OpenView Performance Agent” on page 89.
The following figure shows the steps for importing OVPA data into Server Characterization Editor.
Figure 21: Workflow for Importing OVPA Data into Server Characterization Editor
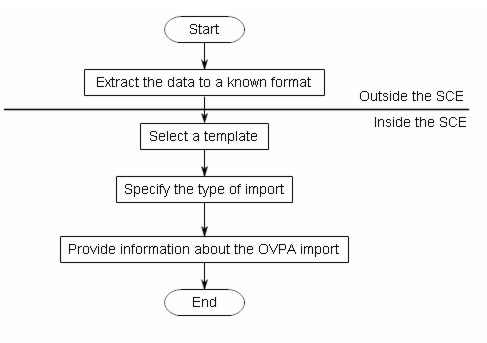
Because OVPA files have a closed format, you must use the OVPA extract utility to convert the files into files with a known format. You can only do this conversion on a computer that is running a licensed version of OVPA.
Procedure 8: importing Data from the HP OpenView Performance Agent
-
Extract the data to a known binary format.
Note: You must perform this operation on a computer that is running a licensed copy of OVPA.
Riverbed Modeler supports data extraction with a number of scripts that come with the Riverbed Modeler models in the following directories:
<install_dir>/models/std/servers/agents/OpenView/unix
<install_dir>\models\std\servers\agents\OpenView/nt
The syntax for running the script is:
opnet_ovpa_unix.sh platform log-directory type project-name [parameters for extract]where:
Table 4: Parameters of the Extract Program
Parameter Description platform Indicates the platform on which the data was collected (solaris, hpux, aix, or nt) log-directory The directory containing the OPVA log files (logglob, logproc, logappl, and logdev). For most systems, this is /var/opt/perf/datafiles. type The type of extraction (-proc, -appl, or -combined) project-name The name used for the known format file. The .txt file extension is added automatically. You can pass additional parameters to the extract program. For a complete list of parameters run man extract. Some common parameters are listed in the following table.
Table 5: Additional Parameters of the Extract Program
Parameter Description -v Run in verbose mode. This gives a more detailed output. -b, -B Specify a start time -e, -E Specify an end time -s Specify shift times **Warning—**If you do not specify start and end times for your data, the extract program processes the default range of values. This can create large data files that contain more information than necessary and increase the complexity of your analysis.
-
Transfer the data files to the computer that you use to generate the characterization. All subsequent steps take place in Riverbed Modeler.
-
From the System window, select File > New…
The New dialog box opens.
-
Click on the drop-down menu, select Server Characterization, and then click OK.
A new Server Characterization Editor window opens behind the Select a Project Template dialog box.
-
Select the template you want to use from the list, and then click Next.
The Import Type dialog box displays.
-
Select the HP OpenView Performance Agent option, and click OK.
The Select Extracted OVPA Report File dialog box displays.
-
Use the file chooser to select the data file generated in step 1.
-
Click Open to run the import operation and close the dialog box.
Importing Data from BMC Patrol
BMC Patrol stores the data it collects in closed format files. While older versions of Patrol support other formats, import into Server Characterization Editor is limited to UDR data formats. It is generally recommended that imports be done using Patrol's collect facility as it generates the most reliable data extracts. (For information on how to configure BMC Patrol, contact technical support.)
The diagram shows the steps for importing BMC Patrol data into Server Characterization Editor.
Figure 22: Workflow for Importing BMC Patrol Data into Server Characterization Editor
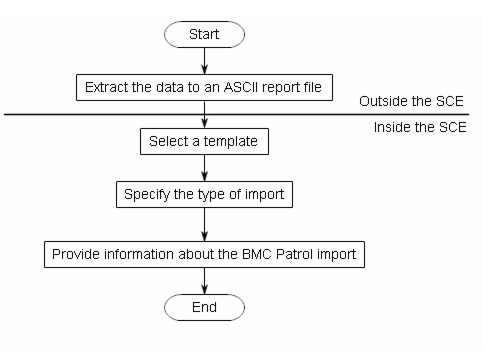
Because BMC Patrol files have a closed format, you need to use the BMC utility called “printudr” to convert the files into a known format. This utility is run as part of the script described in the following procedure. You can only do this conversion on a computer that is running a licensed version of BMC Patrol.
Procedure 9: Importing Data from the BMC Patrol Agent
-
Extract the data to a known format.
Riverbed Modeler supports data extraction with a number of scripts that come with the models in the following directories:
<install_dir>/models/std/servers/agents/BMCThis directory contains two scripts (shown below): one for UNIX and another for Microsoft Windows. Select the script for the platform on which the data was collected, not for the platform to which the data is being extracted.
UNIX: opnet_bmc_unix.sh
Windows: opnet_bmc_nt.sh
For example, to extract files that were collected on a Windows system to a Linux computer, use the script opnet_bmc_nt.sh.
The syntax for running the script is
opnet_bmc_<platform>.sh [-r <repository dir>] <reportfile> [<hostname> [ <start_time> <end_time> [<interval> ]]]where:
Table 6: Parameters of the opnet_bmc_<platform>.sh Script
Parameter Description platform Indicates the platform on which the data was collected (unix or nt) repository_dir The path to Patrol's collection repository reportfile The file that contains the data to be imported into Server Characterization Editor. By convention, this file will normally have a .txt file extension. hostname The name of the host from which the data was collected start_time The start of the time interval for which data will be extracted end_time The end of the time interval for which data will be extracted interval The time between collection samples Figure 23: Example of Running a Script to Extract BMC Patrol Data

-
Transfer the data file to the computer that you use to generate the characterization. All subsequent steps take place in Riverbed Modeler.
-
From the main window in Riverbed Modeler, select File > New...
The New dialog box opens.
-
Click on the drop down menu, select Server Characterization, and then click OK.
A new Server Characterization Editor window opens behind the Select a Project Template dialog box.
-
Select the template you want to use from the list, then click on Next.
The Import Type dialog box appears.
-
Select the BMC Patrol option and click OK.
The Select Extracted UDR Report File dialog box appears.
-
Use the file chooser to select the data file you generated in step 1.
-
Click OK to run the import operation and close the dialog box.
Importing Data from Windows Perfmon
Perfmon is a standard Windows utility for measuring system performance. Data can be collected and exported in either binary or .csv (comma separated values) formats.
Binary format files are the preferred format, as they have a have a reduced run-time impact on the server being measured. Unfortunately, the files are readable only by using Microsoft supplied libraries, so import of the binary files is not supported on Linux.
The .csv files, although more portable than the binary files, are not recommended for collection. Processes that become active after the initial collection won’t be recorded. Additionally, the overhead associated with writing the data to disk can be enough to suspend all other activity on the server while the data is being written.
WARNING: Collecting data using Windows Perfmon can have a significant impact on system performance.
In addition to the performance metrics, the System Information utility can provide some configuration information that is useful. This is optional, but recommended.
Procedure 10: Importing Data from Windows Perfmon
-
Collect the Perfmon data.
1.1 From the windows menu, start Perfmon by selecting Control Panel > Administrative Tools > Performance.
Alternatively you could run the command “perfmon”.1.2 Expand the Performance Logs and Alerts, and then click on Counter Logs.
1.3 Right-click on the right pane and select New Log Settings From…
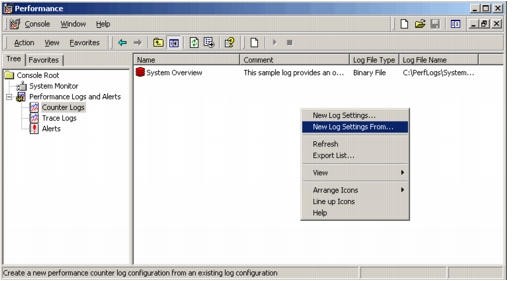1.4 Browse to <Model Directories>/std/servers/agents/Perfmon and select sce_permon_metrics_template.htm.
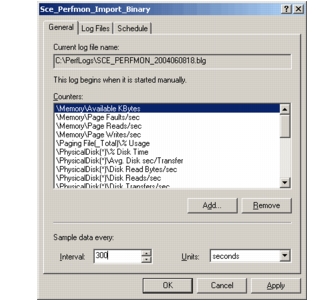1.5 Specify a name for the log; this is not the file name of the generated log file.
1.6 Select the General tab and select an interval appropriate for your server.
1.7 Select the Log Files tab if you wish to change the log file name or the directory in which it will be saved.
1.8 Click OK to save the settings.
1.9 Start data collection by right-clicking on the log settings and selecting Start. Data collection is ended by right-clicking on the log settings and selecting Stop.
Binary files collected on these operating systems can’t be directly read by Server Characterization Editor. These operating systems include a utility to convert the binary files to .csv files called relog. The syntax for running this command is: ```text relog binary-file –f csv –o csv-file ``` - `binary-file` — The full name of the binary file collected by Perfmon, including the file extension - `csv-file` — The output file containing the comma separated values The generated .csv file can then be imported into Server Characterization Editor on either the Windows or Linux platforms. -
Collect the System Information file (optional).
2.1 Start the System Information utility by selecting Programs > Accessories > System Tools > System Information from the Windows menu.
2.2 Click on the System Summary.
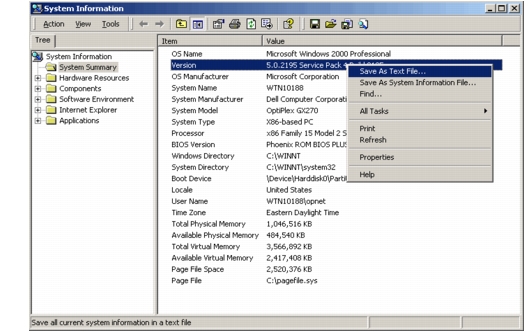2.3 Right-click anywhere in the right pane and select Save As Text File…
-
Extra steps required for Windows 2003 Server and Windows XP only:
3.1 Start the System Information utility by selecting Programs > Accessories > System Tools > System Information from the Windows menu.
3.2 Select File > Export… for the System Information menu.
3.3 Specify a file name and save as a Text File.
-
Transfer the files to the computer that you use to generate the characterization. All subsequent steps take place in Riverbed Modeler.
-
From the System window, choose File > New….
The New dialog box displays.
-
Click on the drop-down menu, select Server Characterization, and then click OK.
A new Server Characterization Editor window opens behind the Select a Project Template dialog box.
-
Select the template that you want to use from the list, and then click Next.
The Import Type dialog box displays.
-
Select the Windows Perfmon option and click OK.
The Specify Perfmon Import Files dialog displays.
-
Use the file chooser to select the data files you collected in steps 1 and 2.
-
Click OK to run the import operation and close the dialog box.
Importing Data from NetIQ AppManager
NetIQ AppManager does not collect data in the same format as other data collectors. NetIQ AppManager produces an XML file, which you can use to import the server data into Server Characterization Editor. This eliminates the need for the separate extraction process the some of the other sources require to generate the XML file that Server Characterization Editor uses to import data.
For information, on how to properly configure NetIQ so that you can import its data into Server Characterization Editor, see “Configuring NetIQ AppManager” on page 91.
Use Procedure 2 to import the NetIQ data into Server Characterization Editor.
Importing from Other Data Collectors
You can also collect data from sources other than explicitly supported data collectors. This includes sources such as databases used as repositories for server sampled data or for home-grown data collectors. To import from these sources, you must create a conversion utility to extract the data and export it to the generic server file format described in “XML Specifications” on page 62.
After the data is converted to the generic XML format, you can import it into Server Characterization Editor using the steps described in Creating a Server Characterization Model.