Rectangular Plot
This view of an antenna pattern shows a linear plot of gain (in dB) versus azimuth angle for a specified polar (elevation) angle. You also can use the rectangular plot to graphically create or modify an antenna pattern, as described in Defining an Antenna Pattern Graphically.
Figure 79: Rectangular Plot
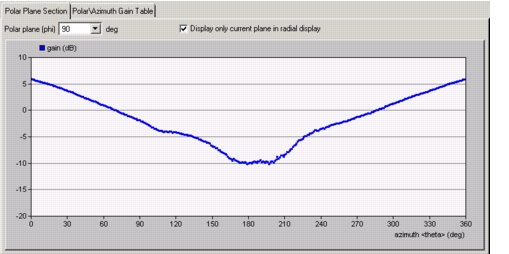
To display the rectangular plot:
Procedure 36: Displaying a Rectangular Antenna Pattern Plot
Caution— Be careful not to click in the white region of the plot when viewing a polar plane. Because the rectangular plot lets you modify the antenna pattern, you could inadvertently change the pattern.
-
Click the Polar Plane Section tab in the Antenna Pattern Editor.
-
Choose the polar plane to be displayed using either of these methods:
- Select a polar plane from the Polar plane pull-down menu.
- Use the keyboard shortcuts
Ctrl+<up-arrow>orCtrl+<down-arrow>to decrease or increase the polar angle, respectively.
-
If desired, change the ordinate (vertical) scale of the plot by Setting the Ordinate Bounds.
Note: If a polar plot is open, you can set it to display only the polar plane shown in the rectangular plot by selecting the "Display only current plane in radial display" checkbox.
Setting the Ordinate Bounds
The Set Ordinate Bounds operations set the upper and lower values for the vertical (gain) axis of the antenna pattern graph. You can set the bounds to any positive or negative integer value, so long as the upper bound is greater than the lower bound.
Note: The bounds of the horizontal (azimuth) axis cannot be changed.
To set the ordinate bounds:
- From the menu, choose Antenna > Set Ordinate Lower/Upper Bound…
- From the toolbar, click the Set Ordinate Lower/Upper Bound button.