Displaying CADRG and CIB Maps
With Terrain Modeling Module (TMM), the Project Editor can display raster images obtained from CADRG (Compressed ARC Digitized Raster Graphics) and CIB (Controlled Image Base) databases. A background display based on actual geographical data can enhance the visual appearance of networks and make it easier to place objects in the correct geographic locations.
Riverbed Modeler reads data from directories that are organized into Raster Product Format (RPF) catalogs. Typically, each directory has one RPF catalog file (a.toc) and one or more directories that contain the CADRG/CIB raster images.
Procedure 12 describes the workflow for showing CADRG/CIB data; for information about configuring the display, see Configuring CADRG/CIB Display.
Procedure 12: Displaying CADRG/CIB Raster Data in a Subnet
-
If necessary, download and install the raster data. (One source of free CADRG data is http://geogratis.cgdi.gc.ca/).
-
Specify the raster data directories:
2.1 Choose View > Background > Add CADRG/CIB Raster Catalog Directories.
2.2 In the directory chooser, select the root directory and click OK. This root directory should contain an RPF catalog file with the file name
a.toc.2.3 In the Confirm Raster Directory dialog box, select the “Check all subdirectories for raster catalogs” option and click OK.
-
Add a new background layer to the subnet where you want to display the raster data:
3.1 Go to the subnet.
3.2 Choose View > Background > Set Properties.
3.3 In the Background Properties dialog box, click Edit CADRG/DIB Properties.
The Properties of Background CADRG/CIB Raster Layers dialog box appears. **Figure 12: Properties of Background CADRG/CIB Raster Layers Dialog Box** 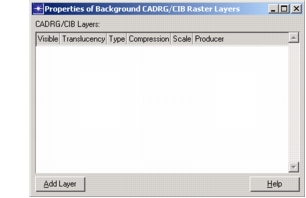 You can use this dialog box to add one or more CADRG/CIB layers for the current subnet. Each layer can have its own level of translucency. You can also specify display filters using the Type, Compressions, Scale, and Producer fields to restrict the set of images that can be displayed in that layer. If you specify Any, the Project Editor will select the most appropriate image based on the current display resolution. For more information about the available options, click Help. -
Use the Add Layer button to add one or more visible layers to the subnet. Each layer will be displayed in the Project Editor as you add it. Then specify the filter and translucency settings for each layer as desired.
Configuring CADRG/CIB Display
Use the preferences listed in the following table to customize the display of raster data in the Project Editor.
Table 5: CADRG/CIR Display Preferences
| Preference | Description |
|---|---|
georender.high_res_tile_cutoff |
Specifies the maximum number of times that a high-resolution map can be scaled down and still be displayed. For example, suppose this preference is set to 23, you have a map with a resolution of 1 kilometer per pixel, and the zoom level is centered on the geographic area defined by the map. • If the zoom resolution is 22 kilometers per screen pixel (map scaled down 22 times), the map will be displayed. • If the zoom resolution is 24 kilometers per screen pixel (map scaled down 24 times), the map will not be displayed. |
georender.low_res_tile_cutoff |
Specifies the minimum resolution for a low-resolution map to be displayed before it is replaced (if possible) by a high-resolution map. For example, suppose this preference is set to 1.2 and you have both a low-resolution map (10 km/pixel) and a high-resolution map (1 km/pixel) of the same geographic area. • If the zoom resolution is more than (10/1.2) kilometers per pixel, the low-resolution map will be displayed. • If the zoom resolution is less than (10/1.2) kilometers per pixel, the high-resolution map with be displayed. |
georender.rpf_dirs |
Specifies a list of directories that contain RPF data. You can edit this table manually or you can add directories as described in step 2 of Procedure 12. |
georender.cache_size_limit |
Specifies the maximum amount of memory (in megabytes) to reserve for caching rasters. |
georender.show_file_boundaries |
Specifies whether boundaries indicating the geographic areas defined by individual raster files should be shown in the Project Editor. When TRUE, boundaries are shown. |
Displaying MrSID Maps
With Terrain Modeling Module (TMM), the Project Editor can display images obtained from Multi-Resolution Seamless Image Databases (MrSIDs). A background display based on actual geographical data can enhance the visual appearance of networks and make it easier to place objects in the correct physical locations.
Note: You can import MrSID images that use latitude/longitude or Universal Transverse Mercator (UTM) coordinates only. Other coordinate systems are not supported.
To import an MrSID image, choose View > Background > Add MrSID Image and select the image you want to import.
If the image coordinates are not in degrees, Riverbed Modeler assumes that the image uses UTM coordinates. A dialog box appears and prompts you to enter the following information: the upper-left point of the image (in UTM coordinates), the zone number, and the hemisphere (northern or southern). Riverbed Modeler needs this information to place the image in the correct geographic location.
Each MrSID image you add becomes a separate layer in the subnet background. You can show/hide the SID layer and also specify the degree of translucency. To manage background layers for the current subnet, choose View > Background > Set Properties.