Optimizing Performance
The performance of a visualization product such as 3D Network Visualizer depends on:
- Processor speed
- Video card
- Available memory
- Size of the terrain database
- The number and complexity of models loaded
- Number of objects in the simulation and how active they are.
You can display statistics to help you evaluate 3D Network Visualizer’s performance. For details, please see Displaying Performance Statistics.
The following actions can affect performance:
- Increasing the size or density of a cloud layer
- Displaying performance statistics
- Use of ground clamping
- Displaying height-above-terrain lines.
The following sections describe options for optimizing performance:
- “Configuring SpeedTree Trees“ on page 342
- “Configuring File Caching“ on page 162
- “Configuring Model Instancing“ on page 320
- “Setting the Clipping Planes“ on page 189
- “Enabling Texture Compression“ on page 163
- “Considerations and Limitations for Building Terrains“ on page 144
- “Filtering Entities Using Interest Management“ on page 284.
Displaying Performance Statistics
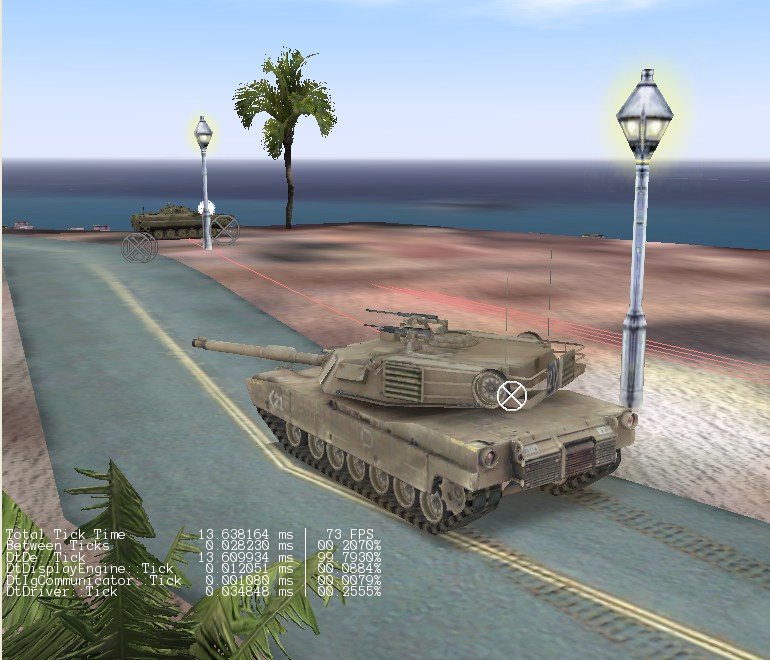
3D Network Visualizer can display two kinds of performance statistics — OSG statistics (Figure 3-8), and 3D Network Visualizer statistics (Figure 3-9).
Figure 51: OSG performance statistics
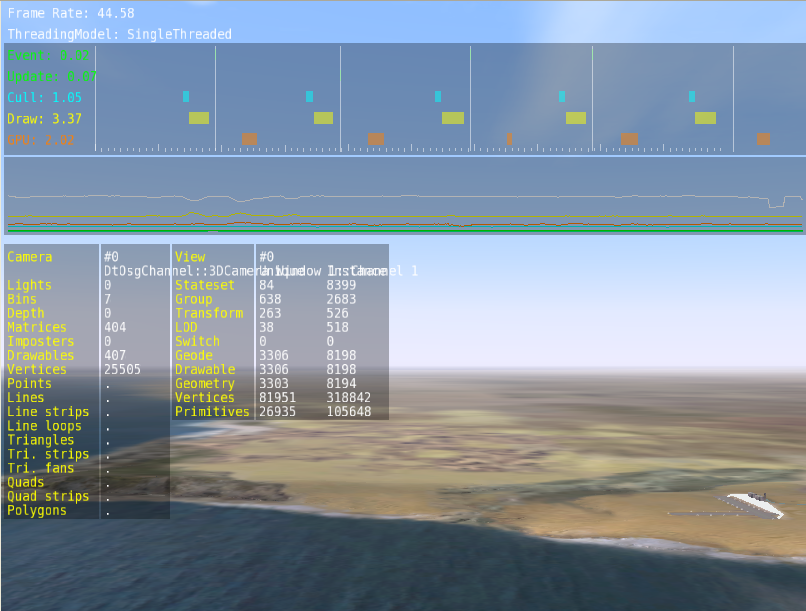
Figure 52: 3D Network Visualizer performance statistics
Note: Displaying performance statistics may affect performance. Displaying OSG statistics may affect performance more than 3D Network Visualizer statistics.
To display performance statistics:
Procedure 29: Displaying 3D Network Visualizer Performance Statistics
-
Choose Settings > Display.
The Display Settings dialog box opens.
-
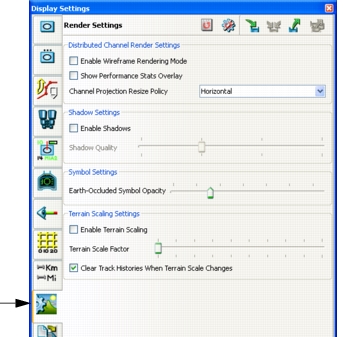
Select the Render Settings page (Figure 53).
Figure 53: Render Settings page
-
Select the Show Performance Stats Overlay checkbox.
A statistics display is added to the window (Figure 52).
Procedure 30: Displaying OSG Performance Statistics
-
Press F2.
The frame rate is displayed.
-
Continue pressing F2.
Additional statistics are displayed. When all statistics are displayed, pressing F2 closes the display.